
Elasticsearch Expert

OpenTelemetry on Elastic: Setup, and the Three Places It Leaks

Instrumenting Python, Node.js and .NET into one stack, with the configs that did it and the three failures we only found by going looking.

OpenTelemetry promises that instrumentation stops being a vendor decision. You instrument once, point an exporter wherever you like, and the backend becomes swappable. Elastic supports that directly: OTLP straight into the stack, rendered by the same APM UI that serves Elastic’s own agents.

The promise mostly holds. This is how we wired up four backend services across three languages plus two browser apps, what the data looks like once it lands, and the three places where the abstraction leaks badly enough to cost you an incident.

All three leaks share a shape worth naming up front: the data was always there and correct. What failed was the layer that was supposed to surface it. None of them raised an error, and every dashboard involved looked healthy throughout.

What we ended up with

Service Spans (30d) Language Distribution host.name
search-api 3,871,094 Python EDOT 1.16.1 (absent)
notify-node 1,073,658 Node.js 18 vanilla OTel SDK linux-app-01
checkout-api 264,811 Python EDOT 1.16.1 (absent)
billing-api 717 .NET EDOT 1.6.0 win-app-01

Plus two browser apps on Elastic’s classic RUM agent, which matters later.

That last column is already a finding. Both Python services report no host at all, so “which machine is this running on” is unanswerable for the two largest span producers in the estate. The Node.js and .NET SDKs detected it; the Python ones did not, and nothing downstream filled the gap. More on the fix for that below.
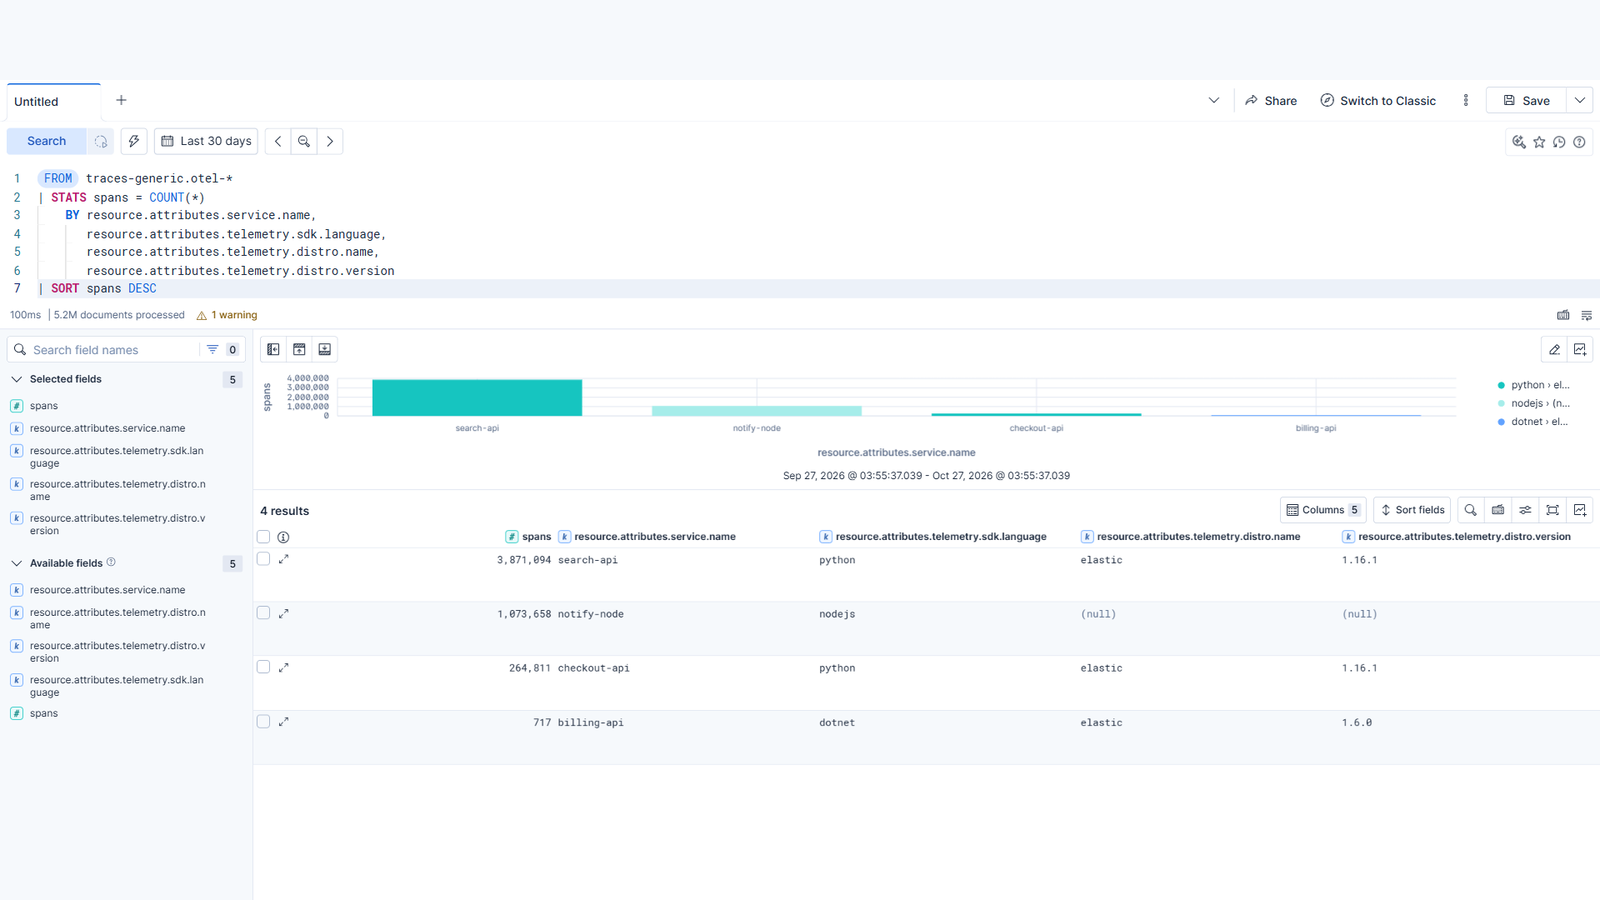
Discover showing spans grouped by service, language and distribution

That table is one ES|QL query, and it is the first thing worth running on any OTel estate:

FROM traces-generic.otel-*
| STATS spans = COUNT(*)
    BY resource.attributes.service.name,
       resource.attributes.telemetry.sdk.language,
       resource.attributes.telemetry.distro.name,
       resource.attributes.telemetry.distro.version
| SORT spans DESC

Note notify-node: distro.name is null. That service runs the plain upstream OTel SDK with no Elastic distribution at all, and its spans land in exactly the same data stream as the other three. On the wire, the distribution is a convenience rather than a requirement, worth knowing before anyone argues about lock-in.

Leak one: a service that sends everything and appears nowhere

That is not the whole story, though, and the gap took us a while to notice. Compare the table above against the APM service inventory:
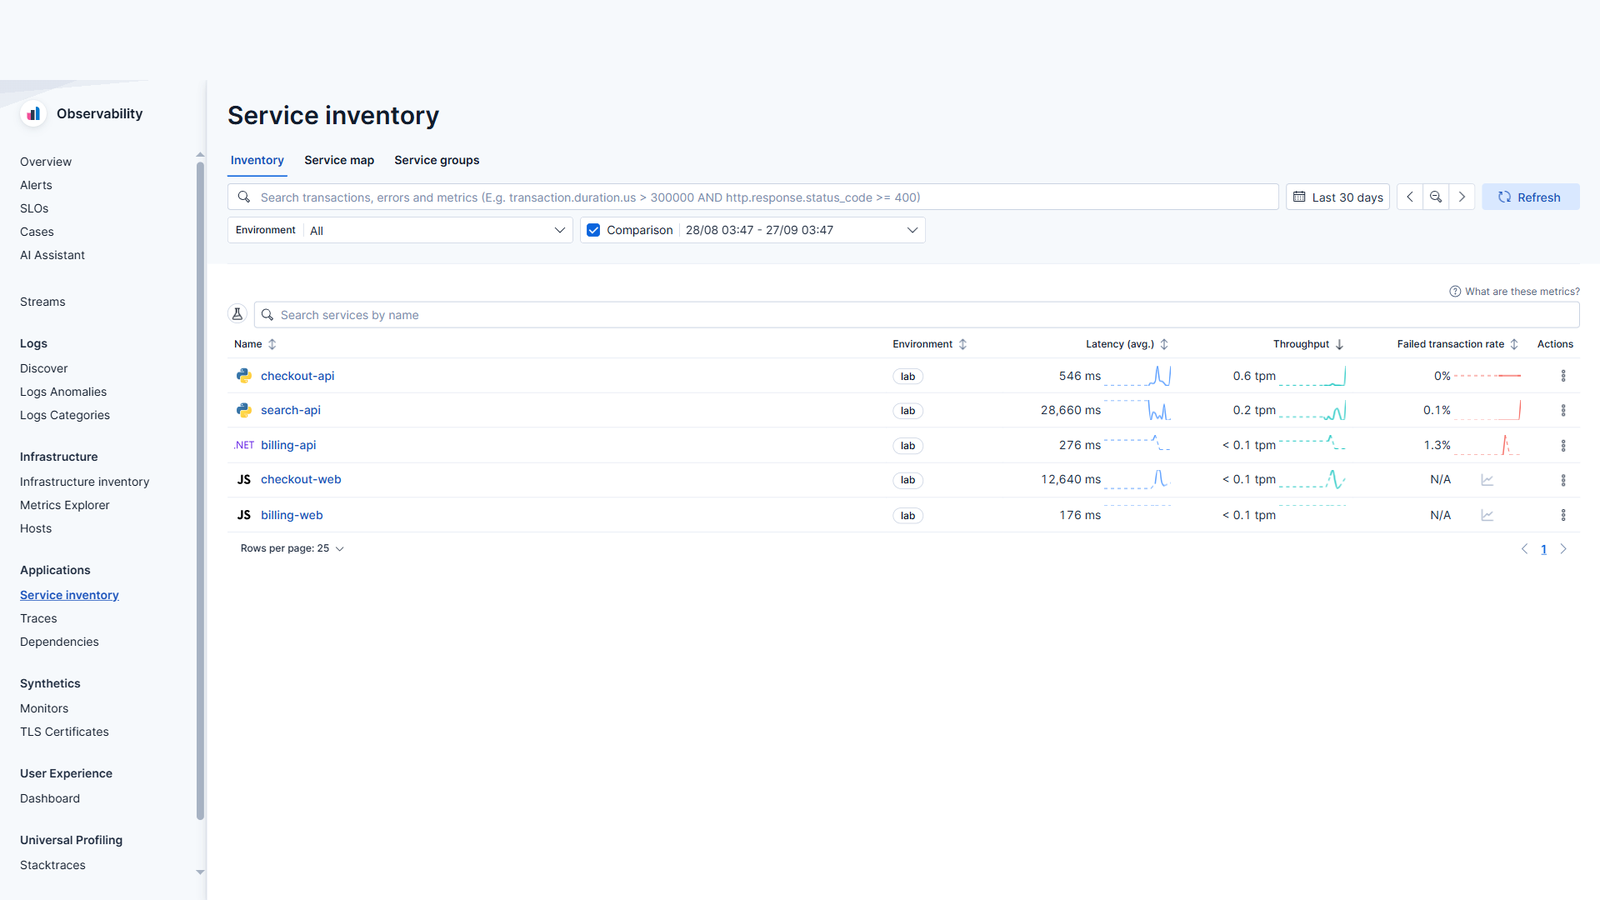
The APM service inventory listing Python, .NET and JavaScript services

Five services, and notify-node is not one of them, despite being the second-largest span producer on the cluster. Its data is in Elasticsearch. It is simply not in the UI.

The reason is that the APM inventory is not built from spans. It reads the pre-aggregated service metrics described further down, and notify-node has zero documents in any of those streams:

Service Server-kind spans Docs in aggregated metric streams
search-api 7,387 193,220
checkout-api 25,484 5,518
billing-api 350 144
notify-node 184,423 0

184,423 server spans, which is what a transaction is made of, and nothing aggregated a single one of them.

The obvious guess is that this service skips the collector and writes to Elasticsearch on its own, missing the elasticapm connector along the way. That guess is wrong, and it is worth checking rather than assuming, because it points at a different fix. Every other signal from notify-node arrives normally:

Signal notify-node documents
Spans (traces-generic.otel-*) 1,073,658
SDK / runtime metrics (metrics-generic.otel-*) 276,735
Logs (logs-generic.otel-*) 184,617
Aggregated APM metrics 0

So it is in the pipeline. Its traces, metrics and logs all land in the same data streams as everything else. The only thing missing is the derived APM layer, which means the gap is in what the elasticapm components recognise, not in network, credentials or routing.

That reframes “you do not need the vendor distribution” into something more precise. The raw signal really is portable: a stock OTel SDK writes a million spans that index perfectly and query perfectly. But the curated APM experience (inventory, service map, latency charts) is built on a derived layer, and a service that does not reach that layer is invisible to it no matter how much data it sends. Query traces-generic.otel-* directly and notify-node is right there, exactly as portable as advertised.

The practical lesson is the asymmetry. “Not in the APM UI” and “not in the cluster” look identical from the UI and are completely different problems. Check the index before you debug the exporter.

The shape of the pipeline

Nothing in this post talks to Elasticsearch directly. All four services export OTLP to one EDOT Collector, which enriches, aggregates and writes:

Python / Node.js / .NET SDKs
          │  OTLP (gRPC 4317 / HTTP 4318), no credential in the app
          ▼
   EDOT Collector  ──  elasticapm processor + connector
          ▼
   Elasticsearch  →  traces-generic.otel-*
                     metrics-*.otel-*
                     logs-generic.otel-*

You can skip the hop and point SDKs straight at APM Server on :8200, and for a handful of services that is defensible. The collector earns itself back on three counts: the API key lives in one place instead of in every application’s environment, enrichment changes without redeploying anything, and it can buffer to disk when Elasticsearch is briefly unavailable, where direct-mode SDKs each drop data independently.

Collector config

This is what we actually run, lightly trimmed. It is the file that ships in the Elastic Agent archive with the commented-out blocks removed:

receivers:
  otlp:
    protocols:
      grpc:
        endpoint: 0.0.0.0:4317
      http:
        endpoint: 0.0.0.0:4318

connectors:
  elasticapm: {}

processors:
  batch:
    send_batch_size: 1000
    timeout: 1s
    send_batch_max_size: 1500
  batch/metrics:
    send_batch_max_size: 0    # never split a metrics request
    timeout: 1s
  elasticapm: {}

exporters:
  elasticsearch/otel:
    endpoints:
      - ${env:ELASTIC_ENDPOINT}
    api_key: ${env:ELASTIC_API_KEY}
    mapping:
      mode: otel

service:
  pipelines:
    traces:
      receivers: [otlp]
      processors: [batch, elasticapm]
      exporters: [elasticapm, elasticsearch/otel]
    logs:
      receivers: [otlp]
      processors: [batch]
      exporters: [elasticapm, elasticsearch/otel]
    metrics:
      receivers: [otlp]
      processors: [batch/metrics]
      exporters: [elasticsearch/otel]
    metrics/aggregated-otel-metrics:
      receivers: [elasticapm]
      processors: []
      exporters: [elasticsearch/otel]

mapping.mode: otel keeps the OpenTelemetry data model on disk rather than translating it into ECS. That is what produces the resource.attributes.* field names discussed in the next section. The alternative mode rewrites into ECS, which makes queries look like classic APM but loses attributes that have no ECS equivalent.

elasticapm appears twice, and they are different components. The processor enriches spans with the fields the APM UI expects. The connector is a pipeline-to-pipeline bridge: it consumes traces and emits aggregated metrics, which is why metrics/aggregated-otel-metrics lists elasticapm as its receiver rather than otlp. That connector is what fills metrics-transaction.1m.otel-* and friends, and the reason the APM UI is responsive. Omit it and your charts go quiet while your traces keep flowing.

batch/metrics sets send_batch_max_size: 0 on purpose. Zero means never split. Splitting a metrics request can separate a data point from the metadata that gives it meaning, so the metrics pipeline batches on time alone. It looks like an oversight in a file otherwise full of explicit sizes. It is not.

What the shipped default leaves out

The config above is Elastic’s starting point, and it is a starting point. Three things we would add before calling it production, none of which are in the file:

extensions:
  file_storage:
    directory: /var/lib/otelcol/storage

processors:
  memory_limiter:
    check_interval: 1s
    limit_percentage: 80
    spike_limit_percentage: 15
  resourcedetection:
    detectors: [env, system]
    system:
      hostname_sources: [os]

exporters:
  elasticsearch/otel:
    sending_queue:
      enabled: true
      storage: file_storage     # disk-backed, not memory
      queue_size: 5000
    retry_on_failure:
      enabled: true

resourcedetection is what stamps host.name, and its absence is not theoretical. notify-node and billing-api report a host; search-api and checkout-api, both Python and between them 4.1M of the 5.2M spans on the cluster, report nothing at all.

The split is by SDK, not by machine. The Node.js and .NET SDKs detected the host themselves; the Python ones did not, and because this processor is not on the pipeline, nothing downstream filled it in. We assumed for months that something upstream was handling it. Nothing was.

That is the argument for doing it at the collector rather than per service: one processor, and every service passing through gets host metadata whether its SDK bothers to detect any or not. Otherwise the answer to “which machine is this running on” depends on which language the team picked, which is not a property anyone intends to have.

memory_limiter goes first in every pipeline. It is what stands between a traffic spike and an OOM kill, and it has to see data before anything buffers it. A collector that dies takes its in-flight queue with it.

sending_queue.storage is the difference between a buffer and a promise. This is the one worth checking against your own assumptions. The collector queue is in memory by default, so a restart loses it, which means “the collector buffers when Elasticsearch is down” is not true until you point the queue at file_storage. If durability was part of why you deployed a collector, it is opt-in and you have to opt in.

One thing to take out, meanwhile: the shipped file lists debug as an exporter on all four pipelines. That is right for a first run and wrong for a long one, because it writes a summary line per export batch forever. Drop it once data is flowing.

Validate before restarting anything:

./elastic-agent otel validate --config otel.yml

Running it

The EDOT Collector ships inside the standalone Elastic Agent archive rather than as its own download:

# unpack the standalone agent, then:
./elastic-agent otel --config otel.yml

# ./otelcol is a thin wrapper around the same command
./otelcol --config otel.yml

The archive also carries otel_samples/platformlogs_hostmetrics.yml, which is the above plus filelog and hostmetrics receivers for collecting the host’s own logs and system metrics. If you want infrastructure telemetry next to your application telemetry, start from that file instead and add the elasticinframetrics processor, which maps host metrics into the ECS fields the Infrastructure UI reads.

Check which sample you copied. otel_samples/ carries several, and they are not interchangeable. One of them is a demonstration:

receivers:
  filelog:
    include: [ /var/log/system.log ]
processors:
  resource:
    attributes:
    - key: service.name
      value: elastic-otel-test       # placeholder
exporters:
  debug:
    verbosity: detailed
service:
  pipelines:
    logs:
      receivers: [filelog]
      exporters: [debug]

That one tails a log file and prints to stdout. No otlp receiver, so it cannot accept SDK data at all; no elasticsearch exporter, so nothing reaches the cluster. A collector running it starts cleanly, passes its health check, logs no errors and moves zero application telemetry. That is the worst failure mode there is, because every signal you would normally check says fine.

The fastest way to tell what you are actually running, from the outside:

ss -lntp | grep -E '4317|4318'     # nothing listening = no otlp receiver

No listener on those ports means the collector cannot receive from an SDK, whatever else the config says.

Pointing the SDKs at it

Every service gets the same variables, defined by the OpenTelemetry spec rather than by Elastic:

# where the data goes: the collector, not Elasticsearch
export OTEL_EXPORTER_OTLP_ENDPOINT="http://collector.internal.example:4318"

# who the data says it is
export OTEL_SERVICE_NAME="checkout-api"
export OTEL_RESOURCE_ATTRIBUTES="service.version=1.0.0,deployment.environment=lab"

No API key in the application. The collector holds the only one:

export ELASTIC_ENDPOINT="https://elasticsearch.internal.example:9200"
export ELASTIC_API_KEY="<base64-api-key>"

Both names match the ${env:...} references in the collector config above. Generate the key in Kibana under Stack Management → API keys with write access to the APM data streams, and inject it at runtime rather than baking it into an image.

Without a collector, each application carries its own key instead:

export OTEL_EXPORTER_OTLP_ENDPOINT="https://apm.internal.example:8200"
export OTEL_EXPORTER_OTLP_HEADERS="Authorization=ApiKey <base64-api-key>"

Moving between the two is a one-variable change per service. The decision is reversible, which is a good reason not to agonise over it up front.

Self-signed certificates

Most lab and on-prem clusters use certificates the collector will not trust. The collector refuses with x509: certificate signed by unknown authority, which is correct behaviour and will still cost you an hour. Point it at the CA:

exporters:
  elasticsearch/otel:
    tls:
      ca_file: /etc/otelcol/certs/ca.crt

insecure_skip_verify: true also works and is what most people reach for first. It is fine for a lab and not fine anywhere else, because it disables the check that stops someone else answering to that hostname.

Sampling

Nobody mentions this until the bill arrives. search-api above produced 3.9M spans in thirty days, and it is one service in a lab.

Sampling is an SDK-side environment variable, spec-defined, same on all three languages:

export OTEL_TRACES_SAMPLER="parentbased_traceidratio"
export OTEL_TRACES_SAMPLER_ARG="0.1"      # keep 10%

parentbased_ is the part that matters in a distributed system. It means a service honours the sampling decision already made upstream and recorded in the traceparent header, so a trace is either kept whole or dropped whole. The plain traceidratio sampler lets each service decide independently, which produces traces with holes in them, the most expensive possible outcome, since you pay to store a waterfall that cannot answer the question you opened it for.

Leave it at 1.0 while you are still verifying the pipeline. Sampling and “my spans are missing” look identical from the UI, and debugging the first while suspecting the second is a bad afternoon.

Instrumenting the services

Python

pip install elastic-opentelemetry
edot-bootstrap          # scans installed packages, installs matching instrumentation

edot-bootstrap is the step people miss. It inspects what your app actually imports and pulls the matching instrumentation packages. Run it in your container build, and re-run it every time dependencies change, or you will silently lose instrumentation for a library you added later.

Start the app through the wrapper rather than directly:

opentelemetry-instrument gunicorn main:app

That is what produced these scopes in our data, with no code changes at all:

opentelemetry.instrumentation.fastapi
opentelemetry.instrumentation.flask
opentelemetry.instrumentation.sqlalchemy
opentelemetry.instrumentation.psycopg2
opentelemetry.instrumentation.requests
opentelemetry.instrumentation.jinja2

Node.js

npm install @elastic/opentelemetry-node
node --import @elastic/opentelemetry-node app.js

Or, if you cannot change the start command, inject it through the runtime instead:

export NODE_OPTIONS="--import @elastic/opentelemetry-node"
node app.js

Our notify-node service does the equivalent with the upstream SDK and a -r ./instrumentation.js preload, visible in its own resource attributes:

process.command_args: ["/usr/bin/node", "-r", "./instrumentation.js", "/srv/app/app.js"]

Either approach yields @opentelemetry/instrumentation-express, -http, -undici and -net scopes.

.NET

dotnet add package Elastic.OpenTelemetry

The package bootstraps the OpenTelemetry SDK at startup, so with the same environment variables set you get Microsoft.AspNetCore, OpenTelemetry.Instrumentation.SqlClient, EntityFrameworkCore and System.Net.Http without touching application code.

Turning on logs

Traces come for free. Logs do not, and this trips people up because the APM UI looks complete without them, until you click into a slow transaction and the Logs tab is empty.

Routing application logs over OTLP is what makes them land in logs-generic.otel-* already carrying trace.id and span.id, which is what correlates a log line to the exact request that produced it. The alternative, shipping log files separately with a filelog receiver or Filebeat, gets the text into Elasticsearch but without that join, which means you are back to correlating by timestamp and guessing.

Python needs it switched on:

export OTEL_LOGS_EXPORTER="otlp"
export OTEL_PYTHON_LOGGING_AUTO_INSTRUMENTATION_ENABLED="true"

One side effect worth knowing before you ship it: that second variable calls logging.basicConfig() internally, which turns your own call to it into a no-op and can silently stop logs reaching stdout. Check your container logs after enabling it, not a week later when someone asks why docker logs is empty.

Node.js EDOT sends logs over OTLP by default. .NET routes ILogger output through the SDK once Elastic.OpenTelemetry is installed.

The section further down on severity values is entirely about what arrives through this path, and why the three languages disagree about it.

Confirming it worked

Services appear in the APM service inventory within a minute or two: Python, .NET and JavaScript RUM side by side, each with latency, throughput and failed-transaction rate, as in the screenshot above. Nothing in that view tells you which ingestion path produced which row, which is exactly the point.

If a service does not appear, check in this order: the endpoint is reachable from the app host, the API key has APM write permissions, and OTEL_SERVICE_NAME is actually set. An unset service name shows up as unknown_service:node rather than nothing at all, which is a useful tell.

And if all three check out, query traces-generic.otel-* for the service name directly before you assume nothing arrived. As notify-node shows above, “absent from the inventory” and “absent from the cluster” are different problems with different fixes.

When that is not enough, the question is always the same. Is the collector not receiving, or receiving and failing to write? Split it with a debug exporter:

exporters:
  debug:
    verbosity: detailed

service:
  pipelines:
    traces:
      exporters: [elasticapm, elasticsearch/otel, debug]

Spans printed to the collector log mean the app is fine and the problem is downstream of the receiver: authentication, TLS, or index permissions, all of which the collector logs on the Elasticsearch side. Nothing printed means the data never arrived, and you are debugging the application, its endpoint variable, or the network between them. Take debug back out afterwards; verbosity: detailed writes every span to disk and will fill a volume faster than you expect.

The schema is the thing nobody warns you about

Here is the single biggest practical difference between Elastic’s own agents and OTLP ingestion, and it touches every query, dashboard and alert you write.

OTel documents keep the OpenTelemetry data model. Classic APM documents use ECS. The same concept has a different field name on each side:

Concept Classic APM (ECS) OTel-native
Service name service.name resource.attributes.service.name
Language agent.name resource.attributes.telemetry.sdk.language
Instrumentation span.subtype scope.name
Span duration span.duration.us duration
Log level log.level severity_text / severity_number
Host host.hostname resource.attributes.host.name
Trace ID trace.id trace.id

Note the last row. trace.id is the one field that survives unchanged on both sides, and that single coincidence is what makes the next section possible.

Everything else means a query written against one path returns nothing against the other. Not an error. Not a warning. Zero results, which reads exactly like “no problems found”.

Pick a side and write it down before you build dashboards.

Leak two: two ingestion paths, one trace, until they aren't

This cluster runs both at once: OTel services on the backend, Elastic’s classic RUM agent in the browser. The obvious question is whether a trace survives the crossing.

It does.
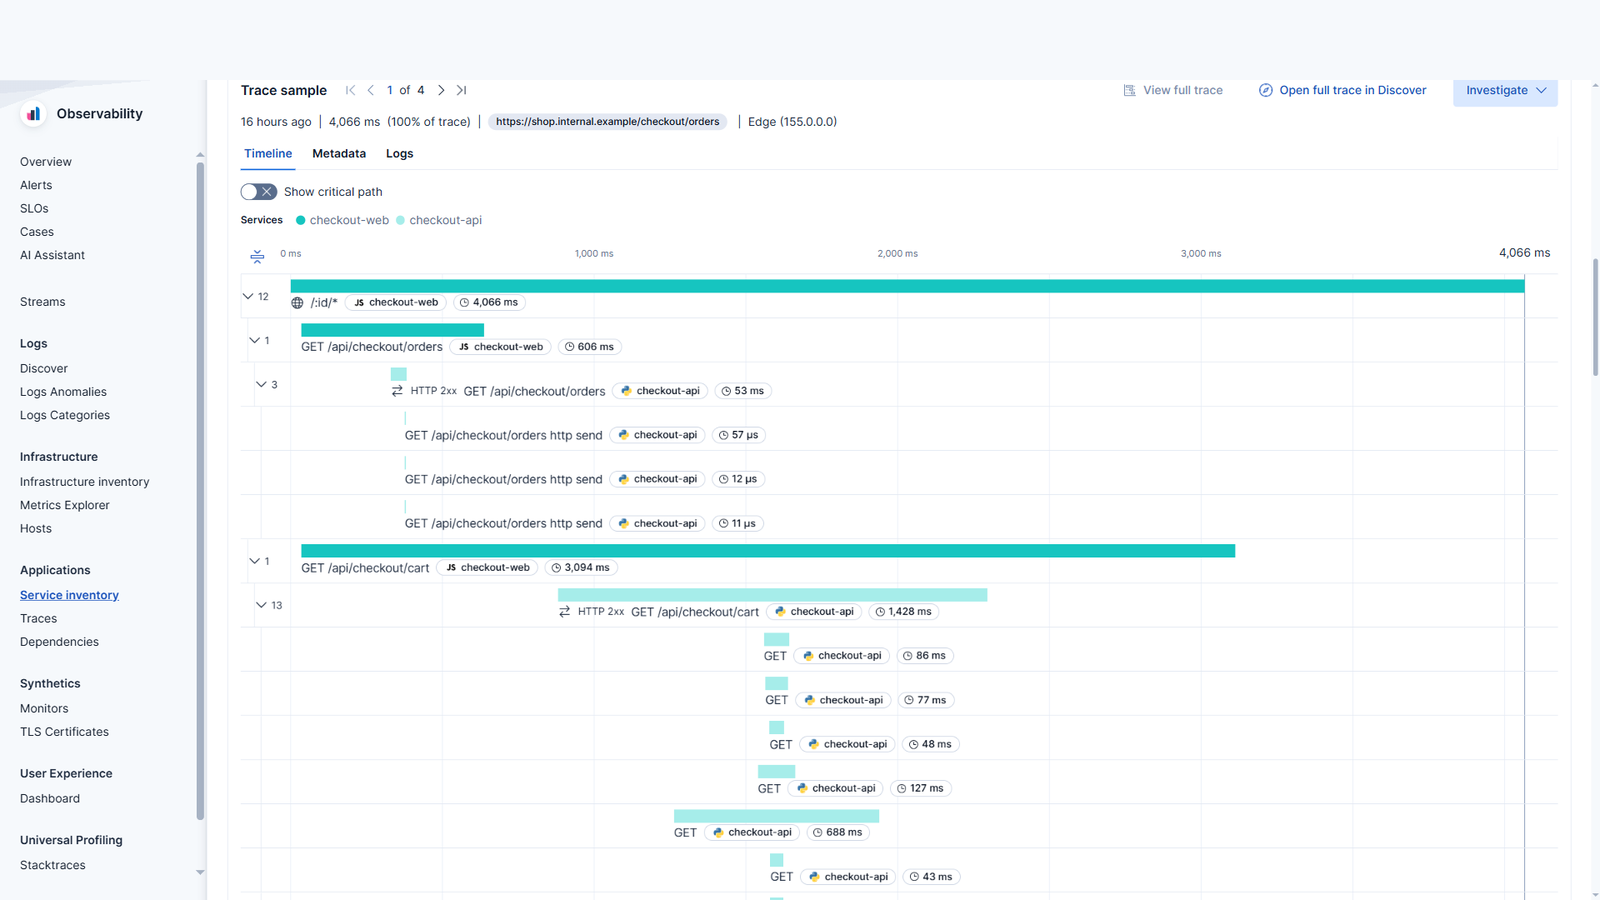
A trace waterfall with browser spans and OTel Python backend spans in one timeline

One waterfall. The JS checkout-web bars are classic RUM transactions; the checkout-api bars underneath are EDOT Python spans. A 4,066 ms route change, two API calls (GET /api/checkout/orders and GET /api/checkout/cart), each resolving into a backend transaction of 53 ms and 1,428 ms with their own children underneath.

Those spans live in different index families, carry different field names, and came from two unrelated SDKs. They assemble into one trace because the browser sent a W3C traceparent header and the Python backend continued it instead of starting fresh. That single trace is 13 spans in traces-apm* and 90 in traces-generic.otel-*, stitched on trace.id alone.

We checked at scale rather than trusting one screenshot. Sampling distinct RUM trace IDs and looking each one up in the OTel indices:

Frontend Trace IDs sampled Traces that joined Backend spans found
checkout-web 50 39 1,550
billing-web 20 (all of them) 0 0

One works. The other produces nothing at all. And note that for billing-web those 20 are not a sample, they are every trace it has ever recorded.

Why one of them fails

Zero is a suspiciously clean number, so it is worth knowing which zero this is. The time windows overlap, so it is not a sampling artefact. The answer is in what each frontend emits:

Span type checkout-web billing-web
external / subtype http (outgoing HTTP) 24,340 0
resource (images, CSS, scripts) 221 70
hard-navigation (page loads) 147 67

The working frontend records 24,340 outgoing HTTP calls. The broken one records none. Not few, none. It captures page loads and asset timings and nothing else, which means its RUM agent is not instrumenting API calls at all.

The ratio is the tell. Both frontends record page loads in the same order of magnitude (147 against 67), so this is not a traffic-volume story. One of them has an entire category of span missing.

That is the whole explanation. A traceparent header has to be attached to an outgoing request. If nothing instruments the outgoing request, there is no header to attach. The backend receives a bare call, starts a brand new trace, and the two halves of the journey become permanently unjoinable.

For a browser RUM agent that means distributed tracing must be on, and the API origin must be in the allowed list:

elasticApm.init({
  serviceName: 'checkout-web',
  serverUrl: 'https://apm.internal.example:8200',
  distributedTracing: true,
  distributedTracingOrigins: ['https://api.internal.example'],
})

distributedTracingOrigins is the part that bites on cross-origin setups. Same-origin calls propagate by default; anything on another host does not, unless you list it.

The failure is invisible from either end. The frontend shows healthy page-load data. The backend shows healthy transactions. Only the join reveals it, and only if you go looking.
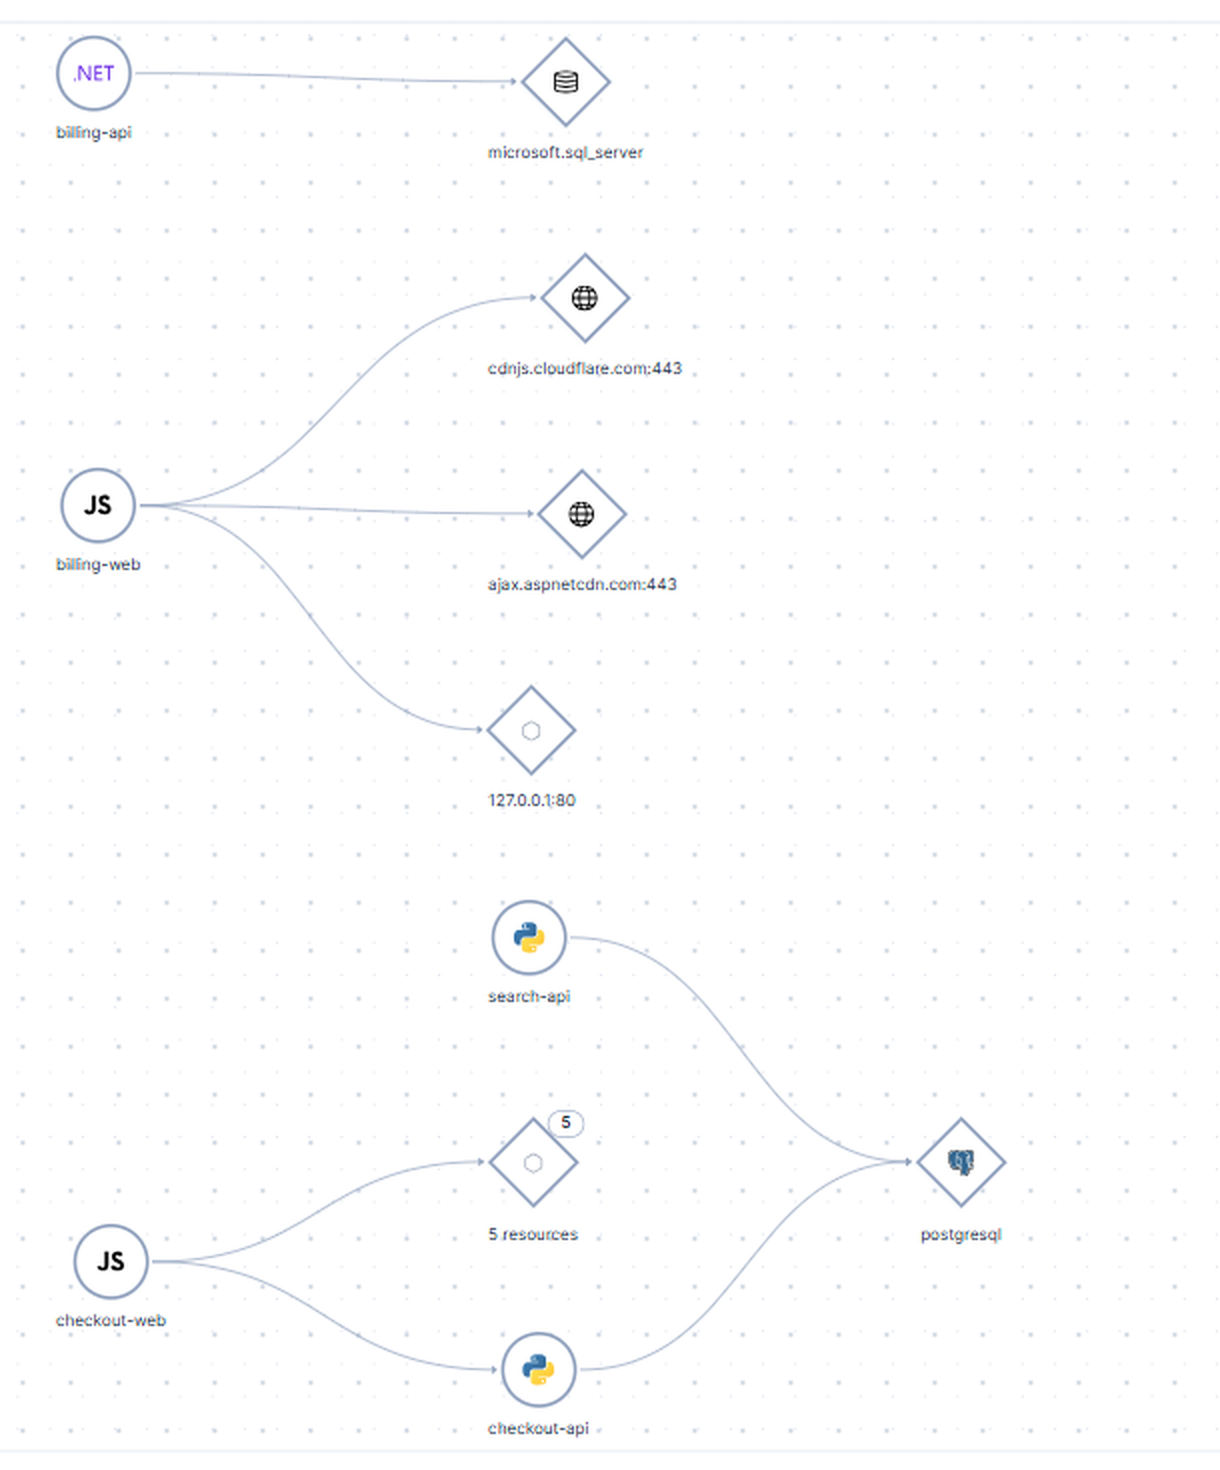
The service map showing the browser service connected to its Python backend, and the .NET service orphaned from any frontend

The service map tells the same story. checkout-web has an arrow into checkout-api, which has an arrow into postgresql. billing-api connects out to microsoft.sql_server but nothing connects into it, because its frontend’s traces never reach it.

Here is the check, as a query you can schedule. Sample from the smaller side, look up in the larger:

FROM traces-apm*
| WHERE service.name == "checkout-web"
| STATS BY trace.id
| LIMIT 100

Then confirm those IDs exist in traces-generic.otel-*. A healthy join returns matches for most of them. A broken one returns zero, every time, and never raises anything.

Leak three: severity is not standardised, and it will bite you

The last one is smaller and sharper, and it is the one most likely to be sitting in your cluster right now.
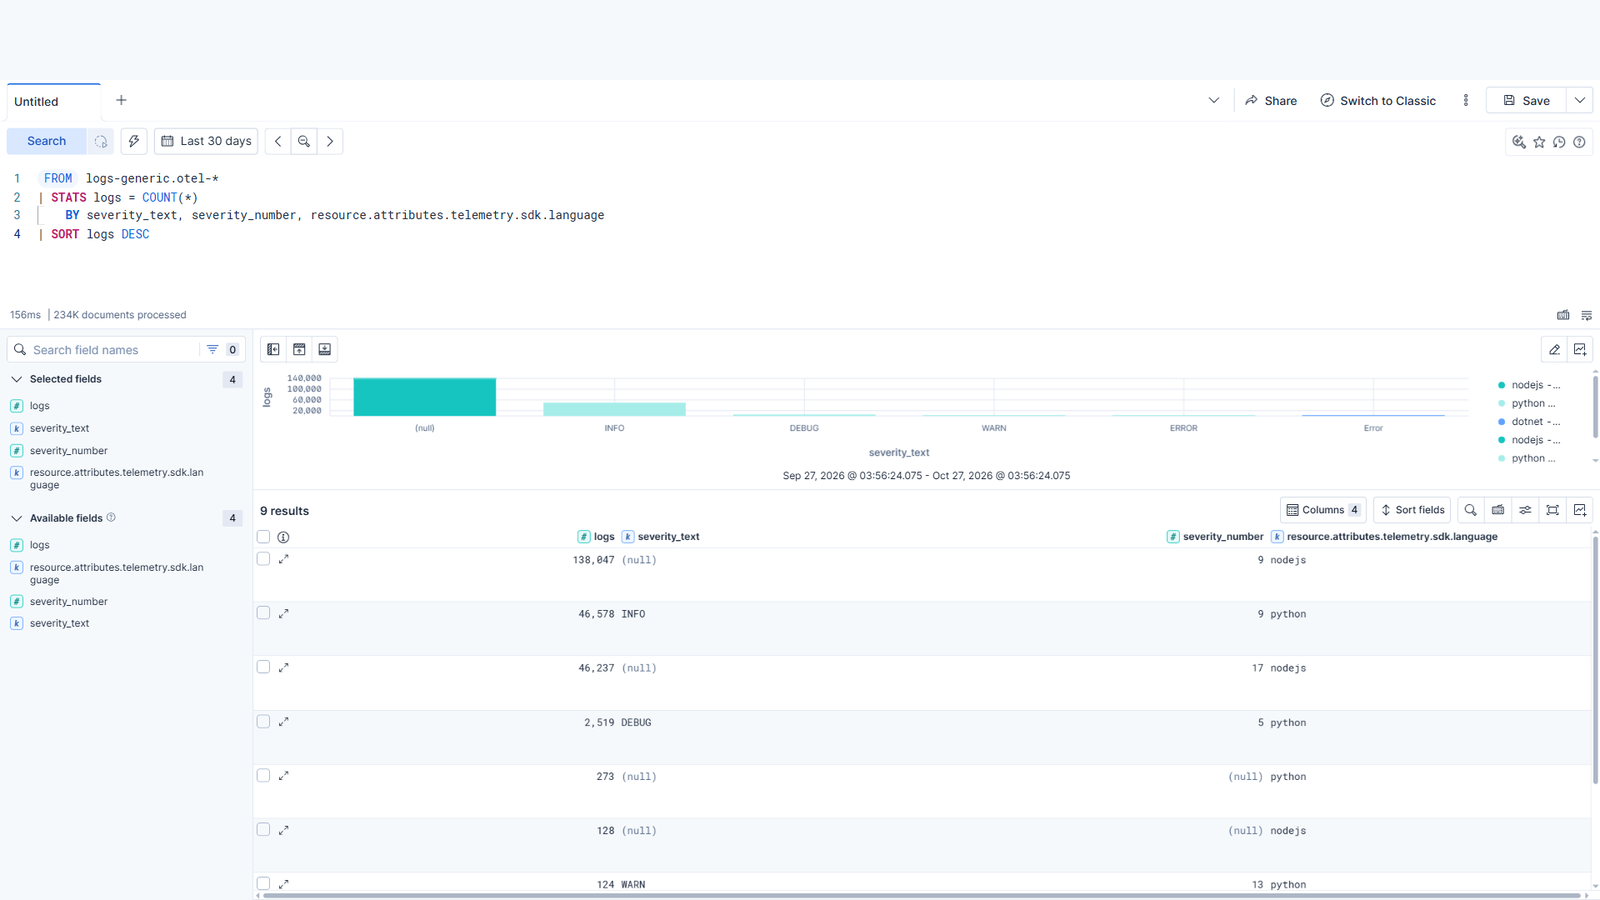
An ES|QL breakdown of severity_text and severity_number by SDK language
FROM logs-generic.otel-*
| STATS logs = COUNT(*)
    BY severity_text, severity_number, resource.attributes.telemetry.sdk.language
| SORT logs DESC

Three languages, three different conventions, in one cluster:

SDK severity_text severity_number Records
Python INFO, DEBUG, WARN, ERROR 9, 5, 13, 17 49,626
Node.js null, not emitted at all 9, 17 184,484
.NET Error (title case) 17 20

184,484 Node.js log records carry no severity_text whatsoever, the single largest group of logs on the cluster, and every one of them invisible to a text-based severity filter. The .NET SDK writes Error; the Python SDK writes ERROR. All of this is legal, because the OTel spec leaves severity_text free-form and only normalises severity_number.

So this alert:

FROM logs-generic.otel-*
| WHERE severity_text == "ERROR"

catches all 92 Python errors, misses all 20 .NET errors because of the casing, and misses every Node.js log because the field is null. Nothing about those numbers would make you suspicious. A dashboard reading “92 errors” looks like a dashboard that is working.

Use the number instead:

FROM logs-generic.otel-*
| WHERE severity_number >= 17        // 17-20 = ERROR and above
| STATS errors = COUNT(*) BY resource.attributes.service.name

severity_number is spec-defined: 1–4 TRACE, 5–8 DEBUG, 9–12 INFO, 13–16 WARN, 17–20 ERROR, 21–24 FATAL. Treat severity_text as a display label and never as a filter.

What EDOT actually adds

If both distributions land in the same place, the question is what the Elastic one buys. Mostly: aggregation you do not have to build.

Four data streams on this cluster hold metrics no application ever emitted. They are derived from the traces on the way in:

Data stream What it holds Documents
metrics-transaction.1m.otel-* per-transaction latency and throughput, 1-minute buckets 175,150
metrics-service_destination.1m.otel-* outbound dependency calls 155,738
metrics-service_transaction.1m.otel-* per-service rollups 28,591
metrics-service_summary.1m.otel-* service-level summary 23,643

383,122 documents summarising 5,212,813 spans. That ratio is the entire point: it is roughly a 14:1 compression, and it is what makes the APM UI responsive over OTel data. Latency charts and throughput sparklines read pre-aggregated 1-minute buckets instead of scanning five million raw spans on every page load.

Worth knowing where that work happens, because it is not the SDK. In our pipeline it is the elasticapm connector in the collector config above, which is why metrics/aggregated-otel-metrics takes elasticapm as its receiver rather than otlp. Traces go in, metrics come out. Send straight to APM Server instead and it does the same job on ingest. Either way it is a component you already have; building the equivalent on raw spans means a span-metrics pipeline and a rollup job you then own forever.

The raw signals land alongside:

Data stream Content Documents
traces-generic.otel-* spans 5,212,813
metrics-generic.otel-* SDK and runtime metrics: system_metrics, Runtime, Process 2,450,521
logs-generic.otel-* log records with severity_text and severity_number 234,140

What we would tell someone starting

Run edot-bootstrap in your build, not once by hand. Instrumentation is resolved against installed packages. Add a library later and you lose its spans silently.

Pick a schema and write it down. resource.attributes.service.name or service.name. Every dashboard, alert and saved query has to commit. Mixed estates are where silent-zero queries come from.

Verify the trace join; don’t assume it. Sample trace IDs from the smaller side and look them up in the larger. A propagation break returns zero matches, and zero is indistinguishable from “these services aren’t related”.

Check your frontend emits outgoing-request spans at all. That is the precondition for traceparent. No external/http spans means distributed tracing is off, whatever else the dashboard shows.

Alert on severity_number, never severity_text. The text is SDK-dependent, inconsistently cased, and sometimes absent entirely.

A stock OTel SDK works, but check it reaches the aggregated metrics. notify-node sends 1M spans with no Elastic distribution and they index perfectly, yet it never appears in the APM inventory, because nothing produced service metrics for it. Portability of the raw signal is real; the curated UI is a layer above that, and you have to land on it deliberately.

Decide sampling before you need to, and make it parentbased_. One lab service wrote 3.9M spans in a month. Per-service sampling decisions produce traces with holes, which is the one outcome worse than not sampling.

Read your own collector config before you trust what it does. Two of our four services carry no host.name at all, and we assumed for months that something upstream was filling it in. Nothing was. resourcedetection is not in the shipped default, and no component adds that field unasked. The same file lists debug as an exporter on every pipeline and leaves the export queue in memory. Defaults are a starting point that runs, not a configuration someone chose for your estate.

The promise largely holds up. Instrumentation really is portable, two very different agents really do assemble into one trace, and the UI really does not care which path the data took.

What the three leaks have in common is more useful than any of them individually. A vanilla-SDK service missing from the inventory, a frontend whose traces never join, a hundred thousand logs with no severity label. In all three the data was present, correct, and queryable the whole time. What broke was the layer in between: a derived metric that was never generated, a header that was never attached, a field convention the spec declined to pin down.

That is the actual lesson of running OpenTelemetry on any backend. The failure mode is not an error. It is a number that looks reasonable, a chart that looks populated, and a query that returns zero rows, which reads exactly like good news.


Figures are from a live Kibana 9.x cluster, measured over 30 days. Screenshots captured at 1920px. Service names, host names, URLs and account identifiers were replaced with neutral placeholders in the browser before each capture. Document counts, span counts, field names, severity values, SDK versions and instrumentation scopes are unmodified.

References: EDOT Node.js setup, EDOT Python setup, EDOT Python configuration, configure tracing collection, default standalone collector config, Elasticsearch exporter, Elastic OpenTelemetry reference.