
Elasticsearch Expert

Full-Stack App Correlation in Elastic Observability

Metrics, logs and traces don't become observability by being in the same cluster. They become observability when they share a key.

Every layer of a web application can be instrumented perfectly and still leave you unable to answer the only question that matters during an incident: what happened to this request?

The browser knows the user clicked Products. The backend knows something asked for /api/products/:id. Postgres knows a query ran. The host knows CPU rose. Four true accounts of one event, and nothing connecting them — so you correlate by eye, lining up timestamps across four screens and hoping.

Correlation is what removes the guessing. This is what it requires, how it fails, and the questions it answers that no single layer can.

Correlation needs a shared key — and fails silently without one

Timestamps are not a join key. Two events a millisecond apart may be unrelated; two events seconds apart may be the same request. What actually joins layers is an identifier minted once, when a request first enters the system, and carried through every hop after it.

For traces that identifier is trace.id, propagated over the wire by the W3C traceparent header. The browser generates it, sends it with each API call, and the backend agent continues the same trace instead of starting a new one.

Which is exactly where correlation quietly dies. Browser RUM agents commonly ship with distributed tracing disabled by default. When it’s off, nothing errors. Traces still appear. Dashboards still populate. The backend simply never learns which trace it belongs to — so every attempt to join the two sides returns zero matches, and zero looks indistinguishable from “these services aren’t related.”

We hit precisely this. The agent’s config read every flag from an environment variable:

rumConfig.distributedTracing = process.env.REACT_APP_ELASTIC_APM_DISTRIBUTED_TRACING === 'true'

With the variable unset, undefined === 'true' is false. No header was ever sent. The trace IDs weren’t failing to match — there was nothing to match. Enabling it is one build-time variable:

ENV REACT_APP_ELASTIC_APM_DISTRIBUTED_TRACING=true

From zero to 99.0%. We sample trace.id from the browser’s own outgoing HTTP spans and look those exact IDs up on the backend. 495 of 500 continue through; the handful that don’t are requests still in flight when the sample was taken.

One measurement detail matters more than it looks. Sample from the smaller side and look up into the larger one. The backend here emits roughly 15× the browser’s volume, so sampling backend-first and hoping to catch browser traces returns a recency artefact that reads exactly like a genuine zero. Getting this backwards is how a working join gets written off as impossible.

Verify the join itself, as a panel, before trusting anything built on top of it:

Join Mechanism
Browser → backend trace.id via W3C traceparent
Span → its page span.transaction.id → parent transaction.id
Backend transaction → dependency backend span’s transaction.id

What a correlated request looks like

With a shared key across the boundary, one request becomes followable through every layer it touched: the page the user was on, the endpoint that page called, the datastore that endpoint hit, and how it ended.
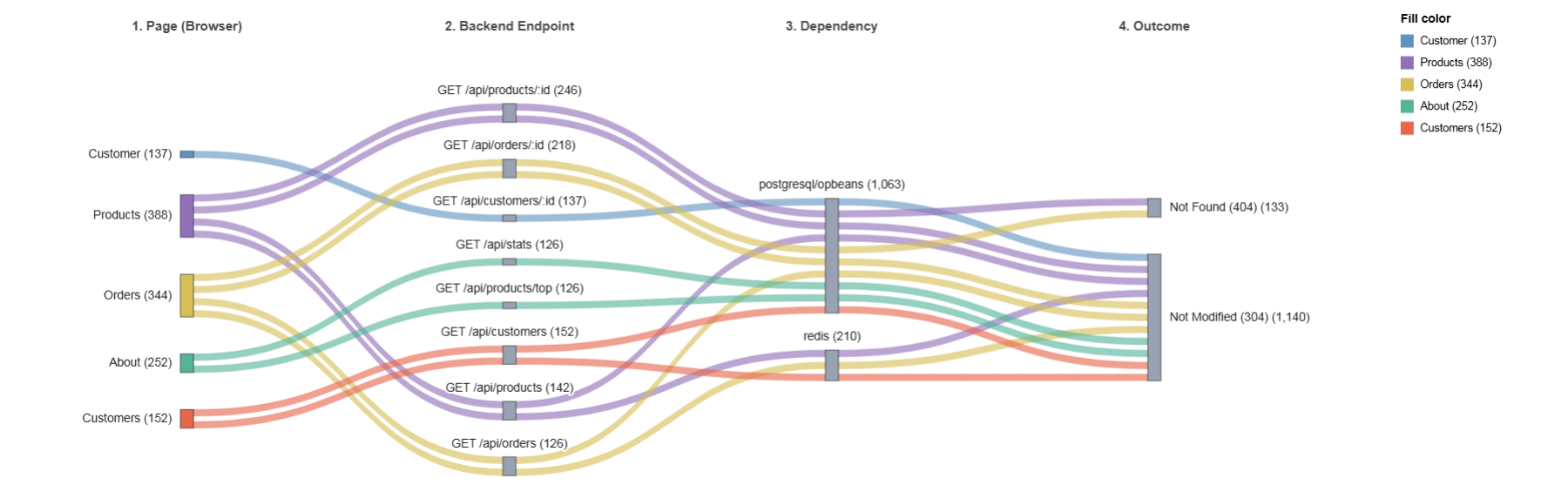
Four-level Sankey: page to backend endpoint to dependency to outcome

Read a single ribbon end to end: Products → GET /api/products/:id → postgresql → Not Modified (304). That chain doesn’t exist in any one index. It’s assembled from three joins, and it’s the difference between “the app is slow” and “this page, through this endpoint, against this datastore.”

Two deliberate choices make it readable. Every ribbon is drawn the same thickness — scaling by volume let one dominant flow swallow the canvas and collapsed everything else into hairlines, so real counts live in the labels instead. And requests that touch no datastore are excluded — static assets and the SPA shell were piling into one enormous “no dependency” node that dominated the chart while saying nothing about the dependency layer. They’re filtered by having no dependency span, not by route name, so the rule survives the routes changing.

The questions one layer cannot answer

Correlation earns its keep in pairs. Each of these is two panels that are individually unremarkable and jointly decisive.

Is the application healthy?

KPI row: documents, transactions, backend error rate, browser errors, cache hit rate

Backend error rate: 0. Browser errors: 1,354.

Both numbers are correct. A backend-only dashboard reports this application as perfectly healthy and is telling the truth about the backend, while over a thousand JavaScript exceptions hit users in the same window. Neither figure is wrong; either one alone is misleading. Errors that never reach your server are still your errors.

How much load is this, really?
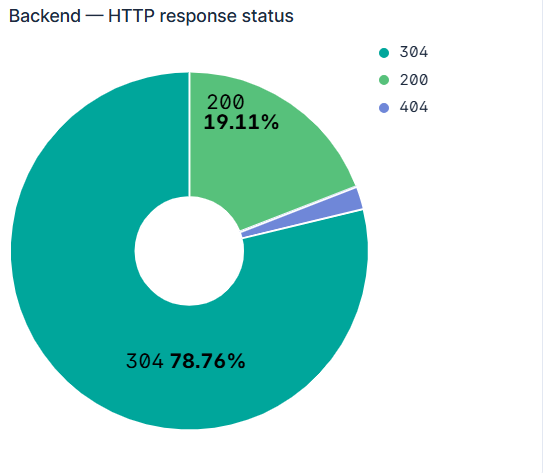
HTTP response status donut: 304 at 78.76%, 200 at 19.11%, 404 present

Nearly four in five backend requests are 304 Not Modified — cache revalidations, not work. Quote the raw request count as “load” and you overstate it roughly fivefold.

The thin slice matters for a different reason: 404s and 500s must not share a metric. A 404 is a caller asking for something that doesn’t exist; a 500 is your defect. A blended “error rate” averages a user’s mistake with your bug and hides both.

Where is the fault?
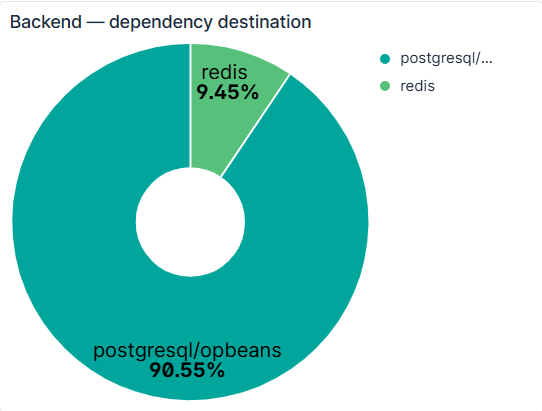
Dependency donut: postgresql 90.27%, redis 9.73%

On its own, a 90/10 Postgres-to-Redis split is a capacity fact. Read against endpoint failure rates it becomes a diagnostic.

We watched this work. At one point every /api/* endpoint was returning HTTP 500 — 100% failure across a thousand calls — while Postgres and Redis spans sat at 0% failure. Every datastore call underneath succeeded. That combination puts the fault above the data layer and below the API surface, in the handler, before anyone opens a log. (The cause was mundane: a database with no schema loaded.)

Correlation narrows the candidate; it does not prove the cause. You still read one real trace to confirm. But it converts “the app is broken” into “the app is broken in the handler” in seconds.

Why does it feel slow when the API is fast?
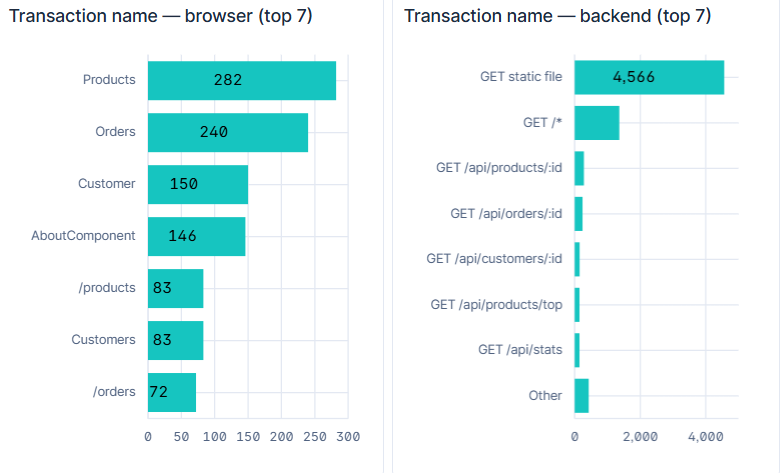
Twin bar charts: browser transaction names vs backend transaction names

Side by side, these say what neither says alone. The browser’s busiest pages are Products, Orders, Customer — real user activity. The backend’s busiest transaction by a wide margin is GET static file, several times every API route combined. The application server is mostly a file server, which is invisible if you only rank API endpoints.
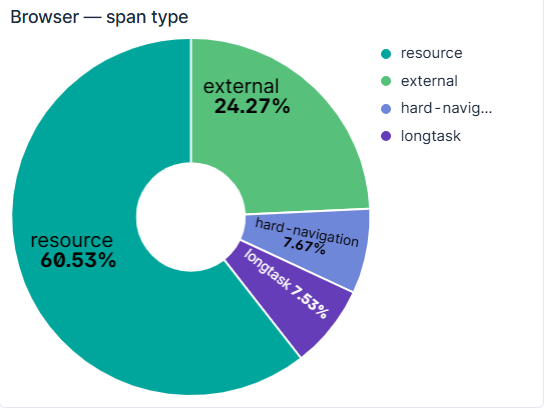
Browser span type donut: resource 60.53%, external 24.27%, hard-navigation 7.67%, longtask 7.53%

And this closes the gap between backend p90 latency of 6.6 ms and what a user actually experiences. Only 24% of browser spans are calls to the API. 60% are resource loads — images, CSS, fonts — and another 7.5% are long tasks, JavaScript blocking the main thread.

The API is not what makes this application feel slow. From the backend’s point of view, nothing is wrong at all.

Is it the code or the box?
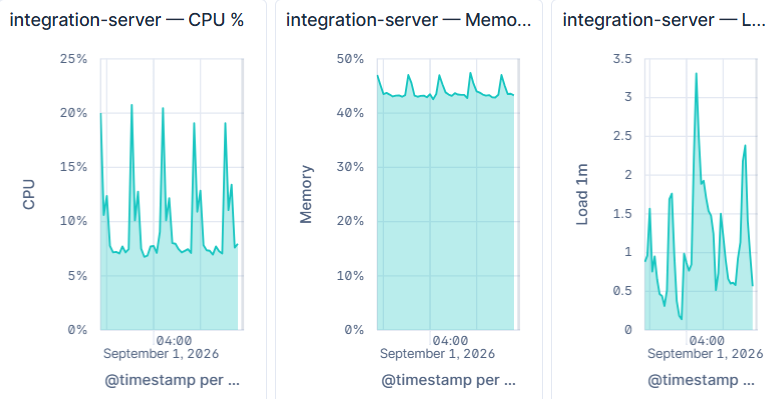
Three sparklines: host CPU, memory, and 1-minute load

Application traces joined to host metrics by host.name. CPU sawtoothing to ~20%, memory flat near 45%, load average swinging between 0.5 and 3.3.

This is the layer that separates “the code got slower” from “the machine is saturated” — and the one most often missing from a dashboard assembled purely from application traces.

(Network and disk are deliberately absent. Those fields are cumulative counters; averaging them yields a confident, meaningless number. A correct rate needs a counter-rate operation, and a missing panel beats a wrong one.)

What holds up

A shared key, not a shared timestamp. Correlation is a join. Without an identifier carried across the boundary, you are eyeballing charts.

Verify the join before trusting anything built on it. A propagation rate on the dashboard turns a silent, invisible failure into a number you can watch. Zero overlap is far more often broken plumbing than unrelated services.

Sample from the side where a match is findable. With a large volume imbalance, the wrong direction manufactures a false negative indistinguishable from a real one.

One number is rarely a finding. Backend error rate 0 is a fact. Browser errors 1,354 is a fact. Only together do they describe the application — and the same is true of endpoint failures against dependency failures, backend latency against browser span composition, and request counts against a cache-hit rate.

That is what correlation buys. Not a denser dashboard — answers to questions a single layer, however well instrumented, structurally cannot give you.