Elasticsearch Expert

Polling pfSense Over SNMP: How We Wired It Into Elasticsearch

A walkthrough of the pipeline architecture, the OIDs we poll, and a look at the live data it's producing.

Our firewall — a Netgate pfSense box — sits at the center of the network, which makes it one of the most valuable things to have telemetry on. Syslog gives us events (blocked connections, rule hits, VPN sessions), but it doesn’t tell us how the box itself is doing: CPU load, memory pressure, interface throughput, error counters. For that, you want SNMP.

This post covers how we built that pipeline, what it actually collects, and what the data looks like once it lands in Elasticsearch.

Why not a Fleet integration?

The instinctive first move on an Elastic stack is: “there’s an integration for that.” We checked. Elastic’s pfsense Fleet package exists, but it only ships log inputs (UDP/TCP syslog) — no SNMP metrics collection at all. Metricbeat used to carry a standalone snmp module years ago; it’s since been retired in favor of Fleet-only support, and no Fleet-native SNMP package exists in our integration registry either.

So instead of forcing a square peg through a Fleet-shaped hole, we went with the tool built for exactly this: Logstash, using the logstash-integration-snmp plugin’s snmp input, running on our integration-server host — the same box already fronting a handful of other collectors (Nanitor, pcc-syslog) that don’t fit neatly into a Fleet policy.

Architecture

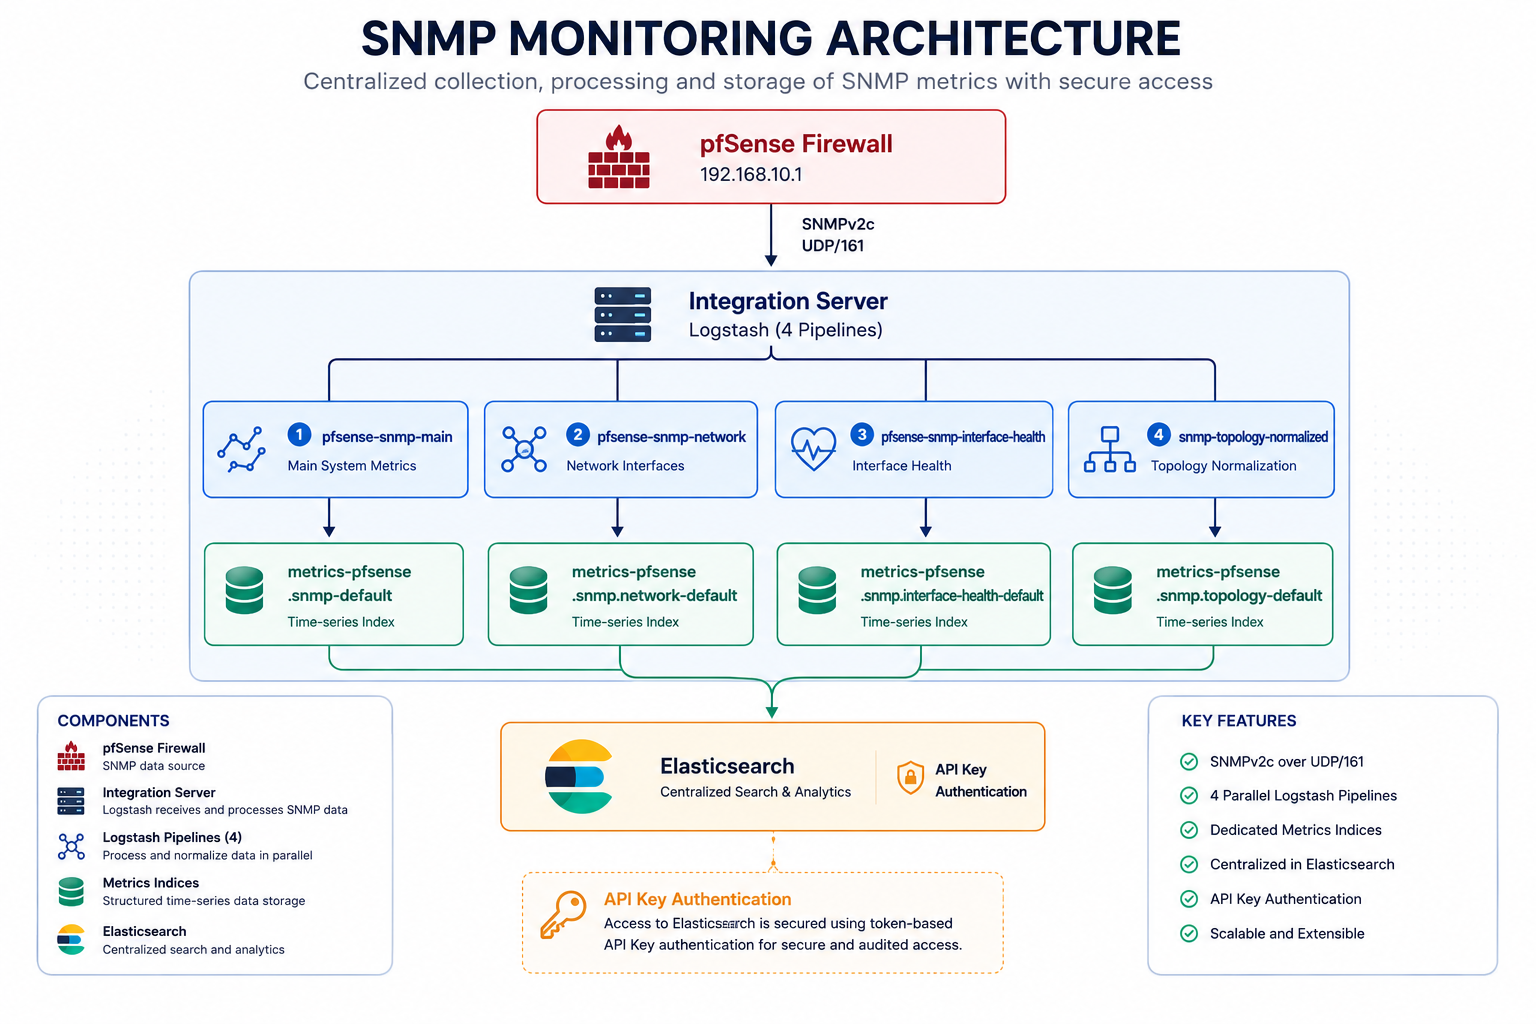
Architecture: pfSense polled over SNMPv2c by four Logstash pipelines on integration-server, each writing to its own metrics-pfsense.snmp data stream in Elasticsearch via api_key auth

Four independent Logstash pipelines, each polling the same firewall over SNMPv2c but asking for different things and normalizing the results into different data streams. Splitting it this way keeps each pipeline’s filter logic small and lets us tune polling frequency or retention per concern without touching the others.

What each pipeline collects

pfsense-snmp-main — the box’s own vitals. Two SNMP inputs run every 60 seconds:

  • A targeted get against seven OIDs: sysDescr, sysUpTime, sysName, and four UCD-SNMP-MIB OIDs for CPU idle percentage and total/available/free RAM.
  • A walk across ifTable (1.3.6.1.2.1.2.2) and ifXTable (1.3.6.1.2.1.31.1.1) — interface names, speeds, status, and the 64-bit high-capacity traffic counters.

A Ruby filter block then does the actual math Logstash doesn’t do for you out of the box: it reads the raw ssCpuIdle value and derives cpu_used_pct (100 - idle), and cross-references memTotalReal/memAvailReal to compute memory_used_pct, memory_used_kb, and friends. Raw SNMP gives you idle percentage and free memory in KB; nobody wants to do that subtraction in a dashboard query, so we do it once at ingest time instead.

pfsense-snmp-network and pfsense-snmp-interface-health — narrower, purpose-built walks over the interface tables, reshaped into two separate data streams so network-topology queries and interface-health alerting can each have a lean, purpose-fit index instead of sharing one wide “everything” stream.

snmp-topology-normalized — takes the same interface/neighbor data and normalizes it into a shape our topology-discovery agent can consume directly (device role, LLDP/CDP-style neighbor relationships) — see soc-l1-agent/agents/siem-topology/CLAUDE.md for how that’s consumed.

Setting it up, step by step

1. Confirm SNMP is actually reachable before writing a single config line.

Don’t skip this — it isolates “is the network/daemon the problem” from “is my pipeline config the problem” before you’ve invested time in either. From the collector host:

$ snmpwalk -v2c -c <SNMP_COMMUNITY_STRING> -O n <pfsense-ip> .1.3.6.1.2.1.1.1.0
.1.3.6.1.2.1.1.1.0 = STRING: "pfSense pfSense.home.arpa 2.7.2-RELEASE FreeBSD 14.0-CURRENT amd64"

If that hangs or times out, the fix is on pfSense’s side first: Services → SNMP — confirm the daemon is enabled, bound to the LAN interface (and IPv4 if you’re polling by IPv4), and that a community string is actually set. Nothing downstream matters until this one command returns cleanly.

2. Install the collector.

We’re using Logstash rather than a Fleet/Metricbeat agent (see above for why). On the collector host:

$ sudo apt-get install logstash

Pin the version to match your Elasticsearch cluster’s major version to avoid client/server compatibility surprises.

3. Write one pipeline config per concern.

Each .conf file in /etc/logstash/conf.d/ follows the same three-block shape — input (one or more snmp blocks, using either get for specific OIDs or walk for a subtree), filter (enrichment — tagging, unit conversion, derived fields), output (where it lands in Elasticsearch):

input {
  snmp {
    hosts => [{
      host      => "udp:<pfsense-ip>/161"
      community => "<SNMP_COMMUNITY_STRING>"
      version   => "2c"
    }]
    interval => 60
    get => [ "1.3.6.1.2.1.1.1.0", "1.3.6.1.2.1.1.3.0" ]   # sysDescr, sysUpTime
    use_provided_mibs => true
    ecs_compatibility  => "v8"
  }
}

filter {
  mutate {
    add_field => {
      "event.dataset"    => "pfsense.snmp"
      "observer.type"    => "firewall"
      "observer.vendor"  => "Netgate"
      "observer.product" => "pfSense"
    }
  }
}

output {
  elasticsearch {
    hosts                  => ["https://<es-host>:9200"]
    api_key                => "<ELASTIC_API_KEY>"
    ssl_enabled            => true
    data_stream            => true
    data_stream_type       => "metrics"
    data_stream_dataset    => "pfsense.snmp"
    data_stream_namespace  => "default"
  }
}

Use api_key from the start, not a superuser user/password pair — it’s scoped, it doesn’t silently expire the way a rotated superuser password will, and it’s the same auth pattern the rest of the stack already uses. A plaintext password baked into a config file is a future outage waiting for a routine credential rotation to trigger it.

4. Register each pipeline in pipelines.yml.

Logstash doesn’t auto-discover conf.d/*.conf files as independent pipelines by default — each one needs an explicit entry:

- pipeline.id: pfsense-snmp-main
  path.config: "/etc/logstash/conf.d/pfsense-snmp.conf"

One entry per .conf file, one line each. This is also what makes systemctl status logstash and journalctl -u logstash report per-pipeline, rather than one undifferentiated blob.

5. Attach retention up front.

Don’t let a new metrics data stream default to unmanaged. Either point it at an existing ILM policy that matches your retention needs, or write a dedicated one, before the first document lands — it’s a one-line addition to the output block’s index template at creation time, and a much bigger cleanup exercise if you add it after the stream already exists unmanaged.

6. Restart and verify from the outside in.

$ sudo systemctl restart logstash
$ sudo journalctl -u logstash --since "1 minute ago" -f

Look for Connected to ES instance and Starting pipeline with no ConfigurationError or repeated Scheduled restart job lines. Then confirm end-to-end in Kibana Discover against the new data stream — a clean systemd status is necessary but not sufficient; the only real proof is a document with a timestamp from the last minute.

Talking to Elasticsearch

Every pipeline’s output block uses api_key authentication (the same key issued to this portal’s backend), not a superuser username/password:

output {
  elasticsearch {
    hosts               => ["https://<es-host>:9200"]
    api_key              => "<redacted>"
    ssl_enabled          => true
    ssl_verification_mode => "none"
    ecs_compatibility    => "v8"

    data_stream            => true
    data_stream_type       => "metrics"
    data_stream_dataset    => "pfsense.snmp"        # varies per pipeline
    data_stream_namespace  => "default"
  }
}

data_stream_dataset is the only line that changes between the four configs — pfsense.snmp, pfsense.snmp.network, pfsense.snmp.interface_health, and pfsense.snmp.topology respectively — which is what fans them out into four separate metrics-pfsense.snmp* data streams on the Elasticsearch side.

Retention

Three of the four data streams are on a shared 10-day ILM policy (metrics-ilm) — rollover at 3 days or 10GB/shard, delete at 10 days total age. That’s deliberately short: this is operational health data for dashboards and alerting, not something we need months of history for. The original metrics-pfsense.snmp-default stream currently has no ILM policy attached — an oversight from before this pipeline existed in its current four-stream form, and on our list to fix by attaching the same policy.

What we're actually getting

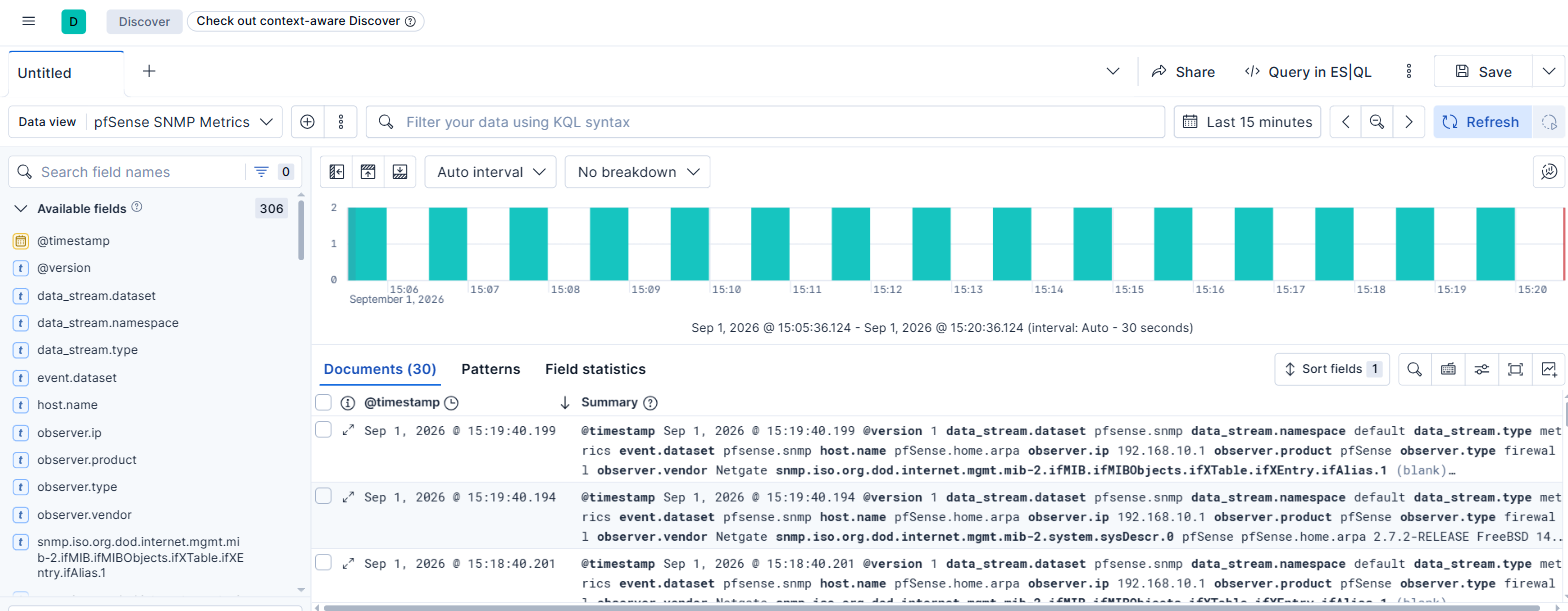
Here’s Discover, live, against the pfSense SNMP Metrics data view:

Live SNMP documents in Discover, showing observer.ip, sysDescr, and steady one-doc-per-minute ingestion

Each pfsense.snmp document carries a consistent set of ECS-style fields regardless of which OID it’s reporting — observer.vendor: Netgate, observer.product: pfSense, observer.ip: 192.168.10.1, host.name: pfSense.home.arpa — so anything querying “what does the firewall look like” doesn’t need to know which specific SNMP walk produced the document.

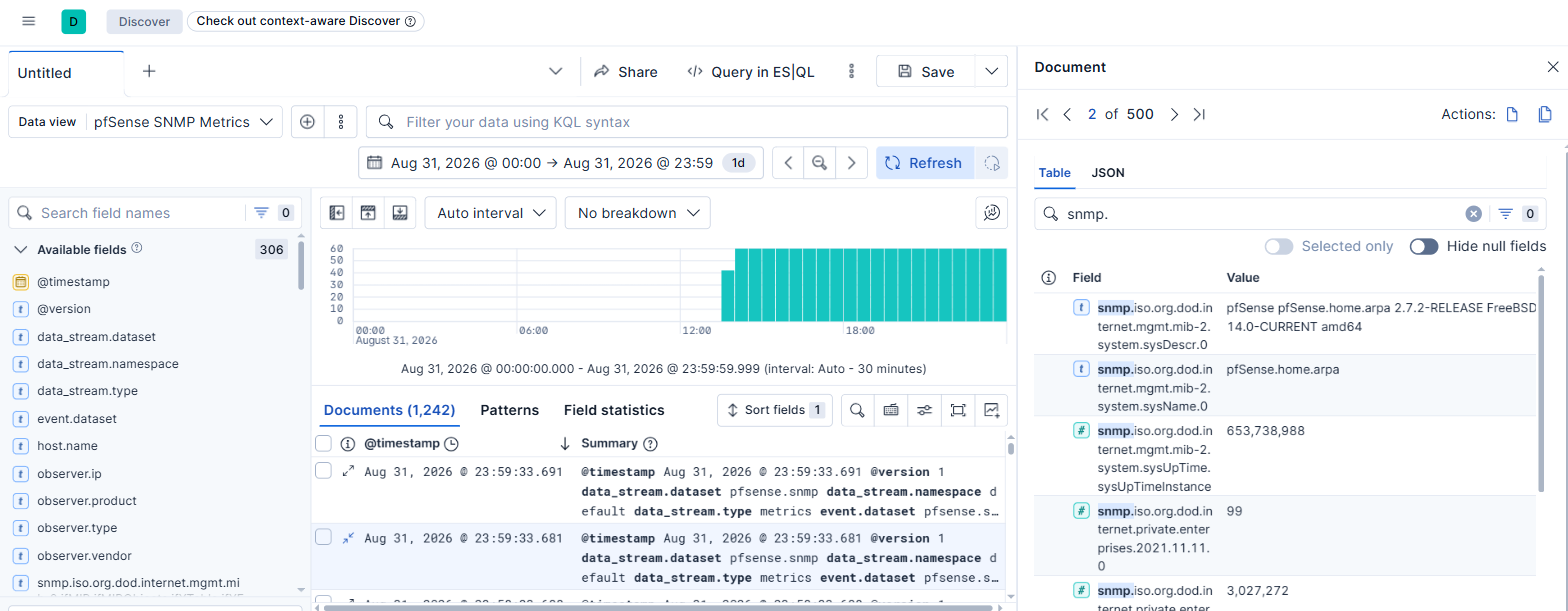
Drilling into a single document shows the raw walk output before enrichment — the actual OIDs, symbolically resolved against the bundled MIBs:

Document detail panel showing resolved SNMP OIDs: sysDescr, sysName, sysUpTime, CPU idle, and memory counters

That sysDescr value — pfSense pfSense.home.arpa 2.7.2-RELEASE FreeBSD 14.0-CURRENT amd64 — is the firewall introducing itself, in its own words, once a minute, forever. sysUpTime (653,738,988 centiseconds ≈ 76 days) confirms the box itself has been rock solid the entire time our collector wasn’t running — this was never a firewall problem, only a pipeline one.

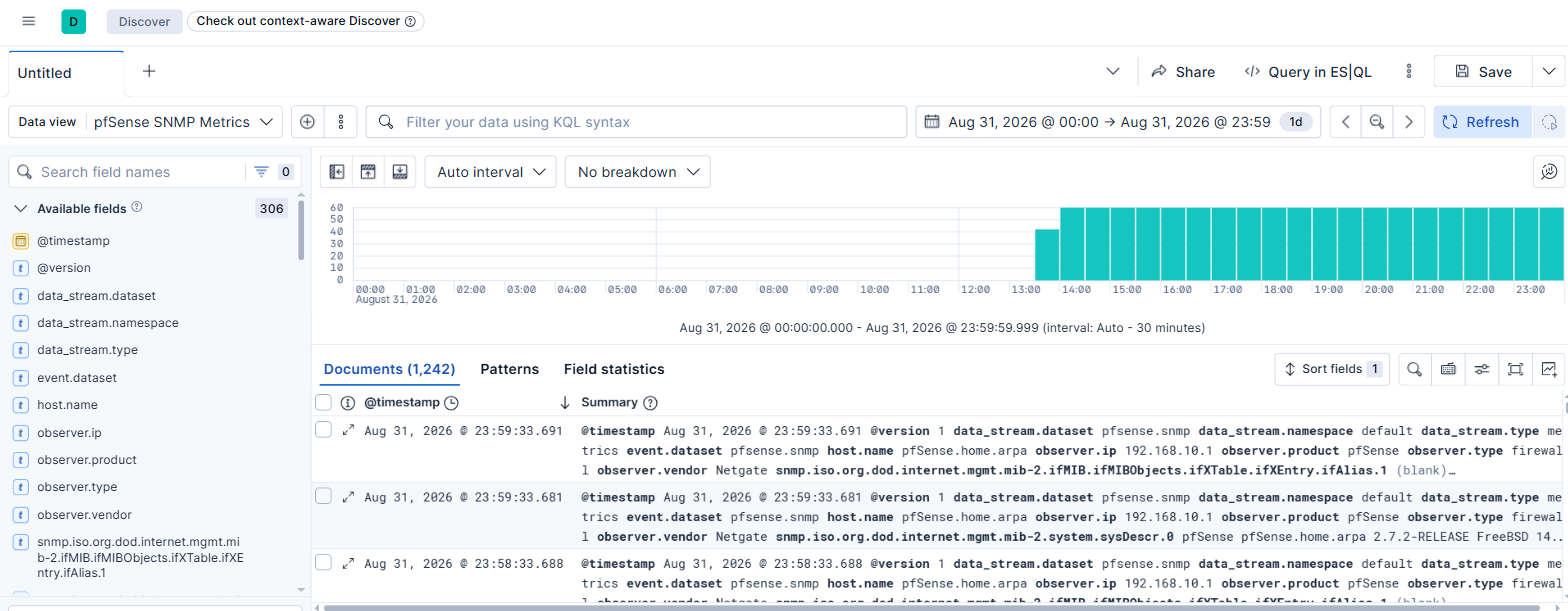
And zooming out to the full day confirms it: nothing, nothing, nothing — then a clean, steady burst of ingestion starting the moment the pipeline came back up.

Full-day histogram: flat all morning, then a sustained burst of documents starting mid-afternoon

Summary

  • Collector: Logstash snmp input (4 pipelines) on integration-server, not a Fleet package — none exists for this.
  • Target: pfSense at 192.168.10.1, SNMPv2c, community-authenticated.
  • Data: system vitals (CPU/memory/uptime), interface counters, network topology, and a normalized topology feed — four purpose-built data streams instead of one wide one.
  • Auth to Elasticsearch: API key, not a superuser password — one less credential to rotate and break later.
  • Retention: 10 days on three streams via metrics-ilm; the fourth still needs the same policy attached.