
Elastic Workflows (Kibana 9.x) is automation that lives inside the stack. You write a workflow in YAML, give it a trigger, and it runs steps against Elasticsearch, Cases, connectors, HTTP endpoints and AI agents. No external orchestrator, no separate runtime, no credentials shuttled between systems.
We have sixteen of them on one SOC cluster. This post walks through three — an alert-noise detector, an ingestion monitor and a Fleet agent check — reading their real execution detail, and then checks what those runs imply against the 1,309 executions already in history.
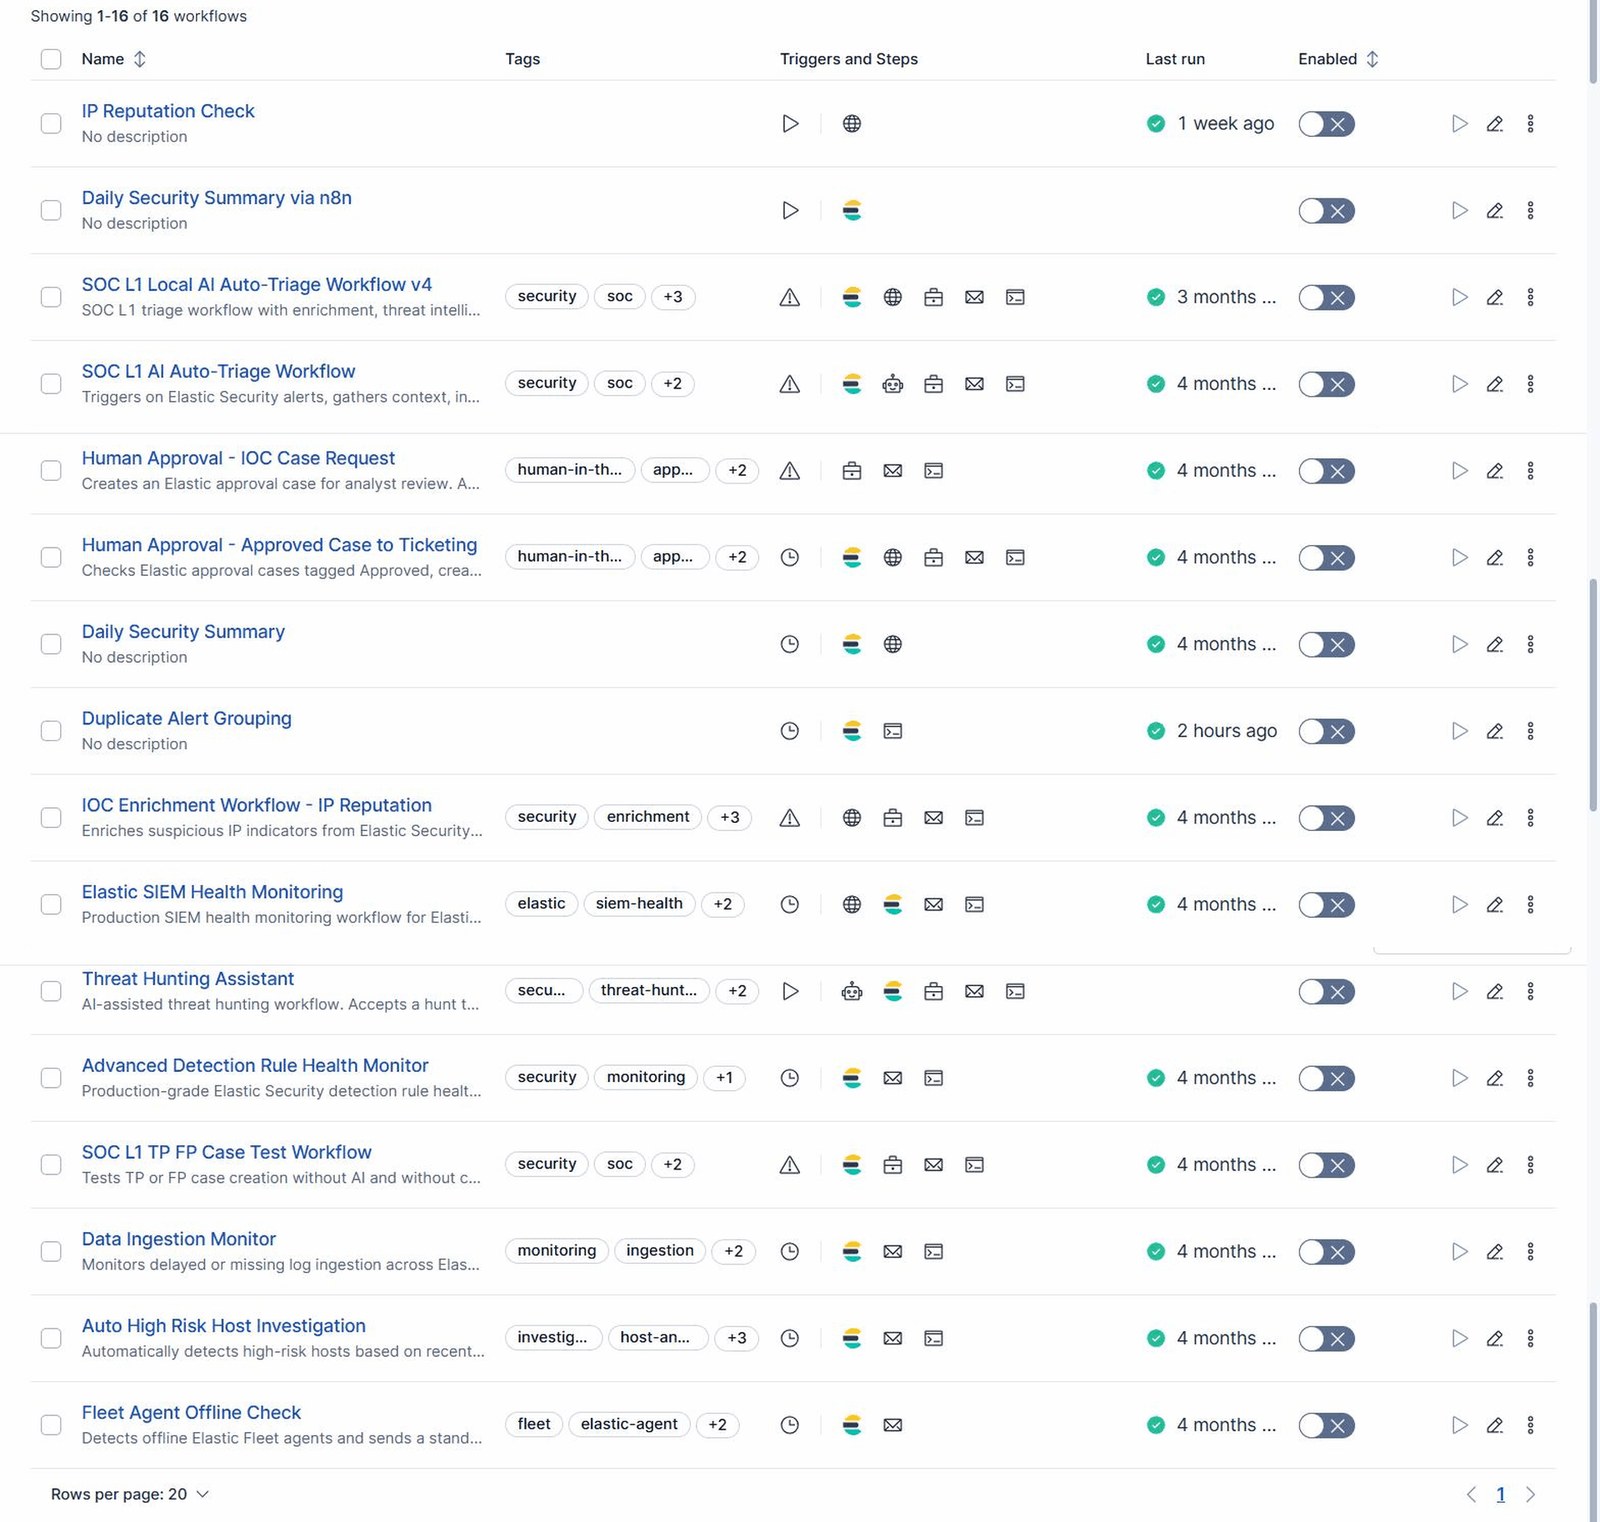
(The full list runs past one screen; the capture above is the same table scrolled through and joined, so all sixteen rows are readable.)
The list view earns a second look before anything else. The Triggers and Steps column renders one icon per trigger and one per step type, so you can read a workflow’s shape — scheduled, five queries, an email — without opening it. The Enabled column is the number that matters most here: every one of the sixteen is off. More on that at the end.
One query, one console step. Nothing leaves the cluster, so it is safe to invoke against production data from the editor.
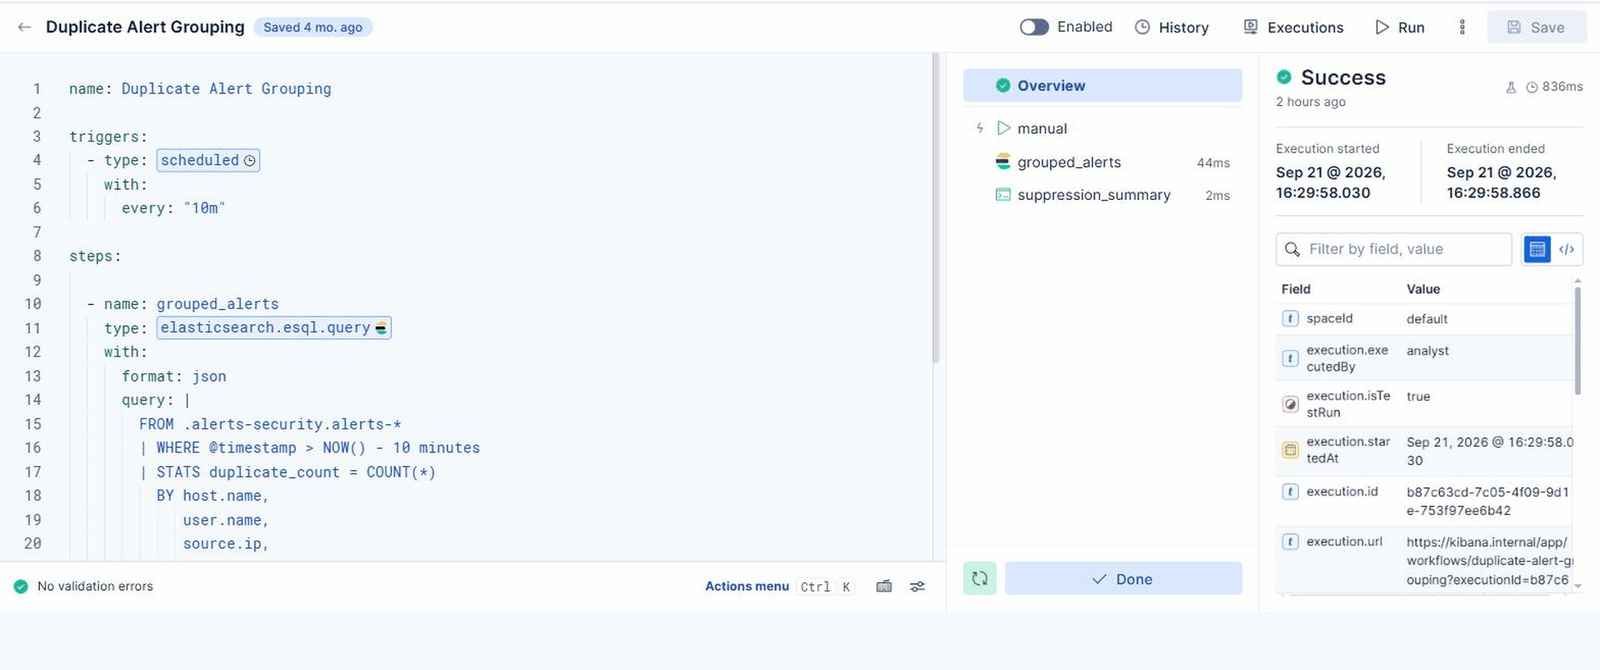
Success in 836ms. The execution pane is the reason to run rather than read. Three things appear that YAML cannot tell you:
- A per-step timeline with real durations —
grouped_alerts44ms,suppression_summary2ms. The two steps account for 46ms of an 836ms run, so roughly 95% of the wall-clock is orchestration, not work. On a 10-minute schedule that is irrelevant; it matters the moment you reach for sub-minute intervals. - The trigger that fired, shown as its own node above the steps. Invoking a
scheduledworkflow by hand is recorded asmanualand flagged a test run — history keeps the two apart. - Every step’s input and output, individually inspectable.
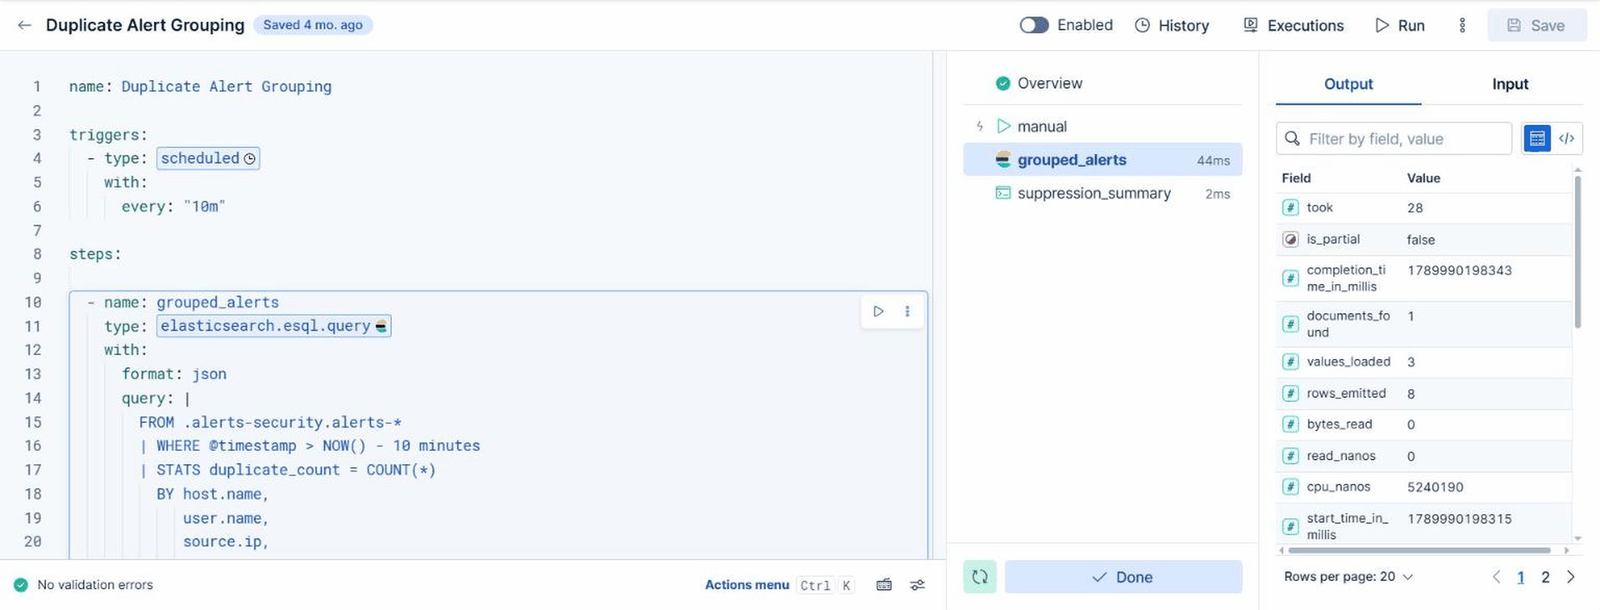
That last one is where the learning is. Click a step and you get its output as a field table:
And the same payload as raw JSON:
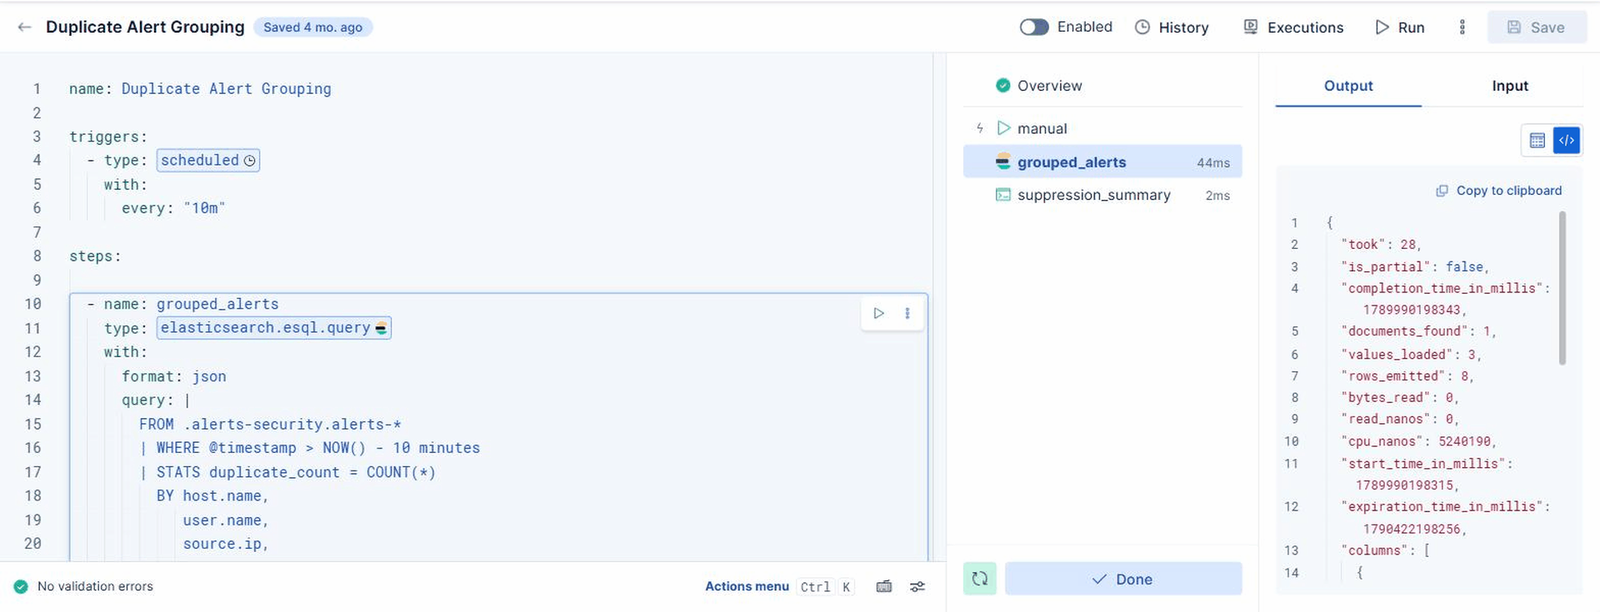
{
  "took": 28,
  "is_partial": false,
  "completion_time_in_millis": 1789990198343,
  "documents_found": 1,
  "values_loaded": 3,
  "rows_emitted": 8,
  "bytes_read": 0,
  "read_nanos": 0,
  "cpu_nanos": 5240190,
  "columns": [ { "name": "duplicate_count", "type": "long" }, … ]
}
Read that carefully, because it is the shape of an ES|QL step’s output and not what most people assume when they write {{ steps.x.output }}. The rows live under .values, their schema under .columns. Alongside them:
is_partial— the field to care about. An ES|QL query that timed out or hit a shard failure returnsis_partial: truewith a successful step status. A downstream step that files a case off partial results reports a partial picture as a complete one, and nothing anywhere is marked failed. If a workflow acts on query results, gate it onis_partial.documents_found: 1/values_loaded: 3/rows_emitted: 8— three different counts, none interchangeable: documents scanned, values materialised, rows returned. Onlyrows_emittedis the size of the result your next step will template over.took: 28vs the step’s own 44ms — Elasticsearch spent 28ms; the rest is the step’s round trip.columns— name and type per column, which is what lets you parse| jsonoutput downstream instead of guessing at positional arrays.
Confirm the output shape before you act on it. Build every workflow with a console step dumping | json, check the structure, then wire in the real action. Guessing the shape and going straight to cases.createCase is how you generate a dozen malformed cases.
The second workflow is the shape most SOC automation actually takes: query, then deliver. It runs every: "15m", looks for log data streams that have gone quiet, and emails the analysts when any of them exceed the delay threshold.
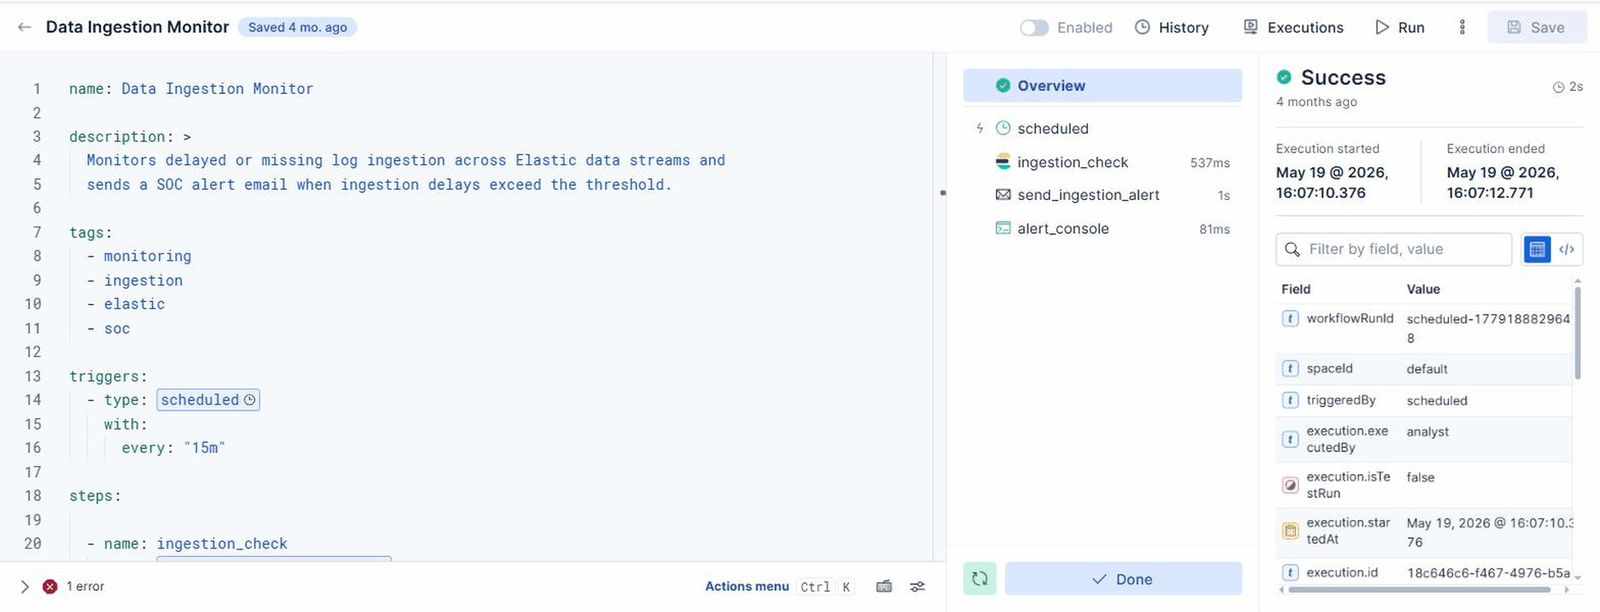
This is a scheduled execution, not a test invocation — triggeredBy: scheduled, isTestRun: false — which is why the trigger node reads scheduled rather than manual. Success in 2s: ingestion_check 537ms, send_ingestion_alert 1s, alert_console 81ms.
Two things are worth pulling out of those numbers. The query is the cheap part: 537ms of a 2-second run. And the email step costs roughly twice what the query does, which is the ratio that holds across the whole library.
The step detail is where an email step stops being a black box:
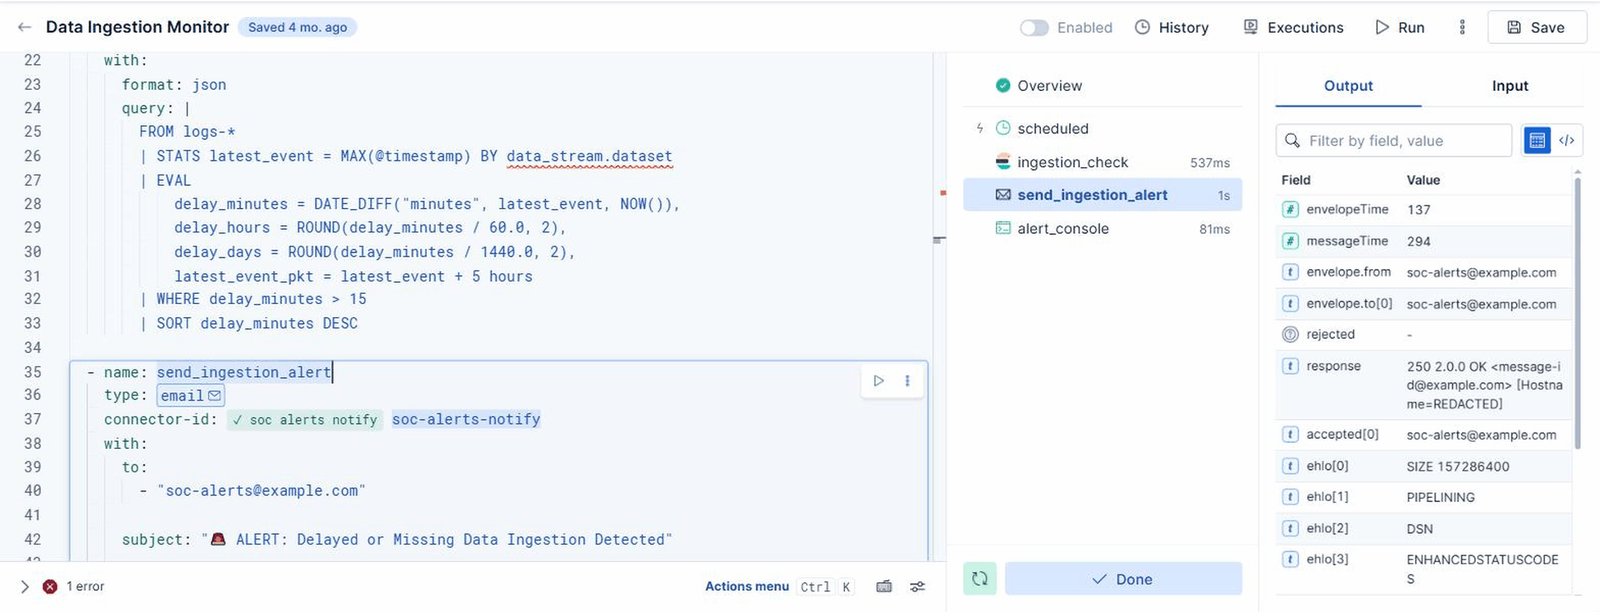
envelopeTime : 137
messageTime  : 294
envelope.from: soc-alerts@example.com
envelope.to  : soc-alerts@example.com
rejected     : -
response     : 250 2.0.0 OK <message-id@example.com>
accepted[0]  : soc-alerts@example.com
ehlo[]       : SIZE, PIPELINING, DSN, ENHANCEDSTATUSCODES,
               AUTH LOGIN XOAUTH2, 8BITMIME, BINARYMIME, CHUNKING
You get the raw SMTP conversation: envelope timing, the server’s capability list, the accepted and rejected recipient arrays, and the literal 250 2.0.0 OK. That rejected array is the field to build on — a step can report success while the mail server silently drops a recipient, and rejected is the only place that shows.
This workflow is also where the Liquid control flow lives. Its message body iterates the query result and branches on the delay magnitude:
{%- for source in steps.ingestion_check.output.values %}

Dataset:
{{ source[1] }}

Last Event Received:
{{ source[4] | date: "%Y-%m-%d %I:%M:%S %p" }} PKT

Ingestion Delay:
{%- if ... %}
Note source[1] and source[4] — positional indexing into the row array. It works, and it is brittle: add a column to the EVAL and every index below it shifts, silently, in the body of an email nobody reads closely. This is the argument for reading .columns rather than counting positions.
The query that was correct when it was written
Look at the status bar in both captures: 1 error. The workflow ran clean in May; the same YAML no longer plans today.
Cannot use field [data_stream.dataset] due to ambiguities being mapped as
[2] incompatible types: [keyword] in [227 indices] and [text] in [1 index]
One newly created data stream mapped data_stream.dataset as text while 227 others map it keyword, and ES|QL refuses to aggregate across a field with two types. Nothing about the workflow changed — the index set underneath it did.
A FROM logs-* wildcard is a promise that every index it matches agrees on your field types, and that promise is not yours to keep. Cast it (data_stream.dataset::keyword) or scope the pattern. It is the clearest example in our library of why a disabled workflow is not a safe workflow: this one would have started failing on a schedule, into an inbox, without anyone touching it.
The third runs every: "1h" against Fleet’s own agent index and reports agents that are enrolled but not checking in.
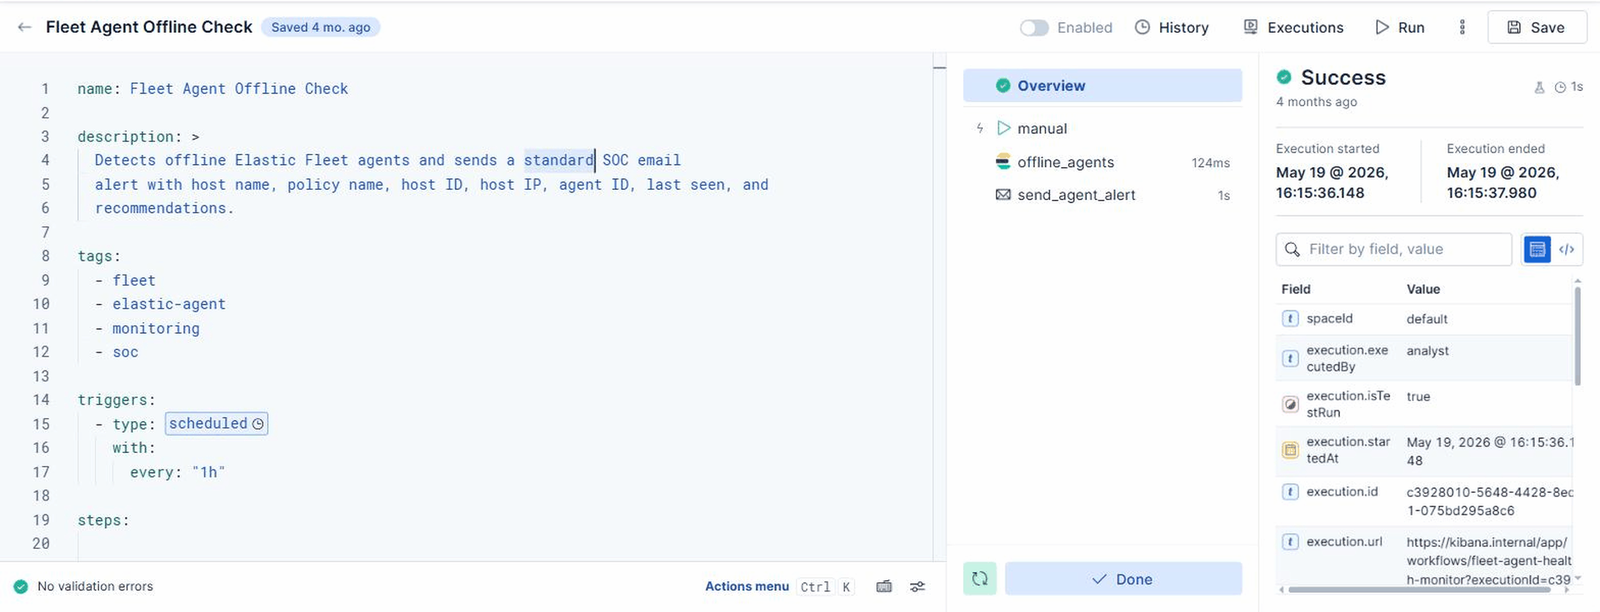
Success in 1s — offline_agents 124ms, send_agent_alert 1s. Same split as before: the query is a rounding error, the delivery is the run.
The useful observation is what the step can reach. FROM .fleet-agents works from a workflow, and so does FROM .kibana-event-log-* and FROM .alerts-security.alerts-*. Workflows query dot-prefixed system indices directly, which is how the interesting operational workflows get built: rule health from the event log, agent health from the Fleet index, alert noise from the alerts index. None of it needs an exporter or an external collector.
Three workflows, three different index families, every query under 550ms. The elasticsearch.esql.query step is the load-bearing part of this feature — 32 of the 79 steps in our library — and it behaved identically in each.
Every run is a document in .workflows-executions, which makes execution history queryable rather than just browsable. The editor shows it per workflow:
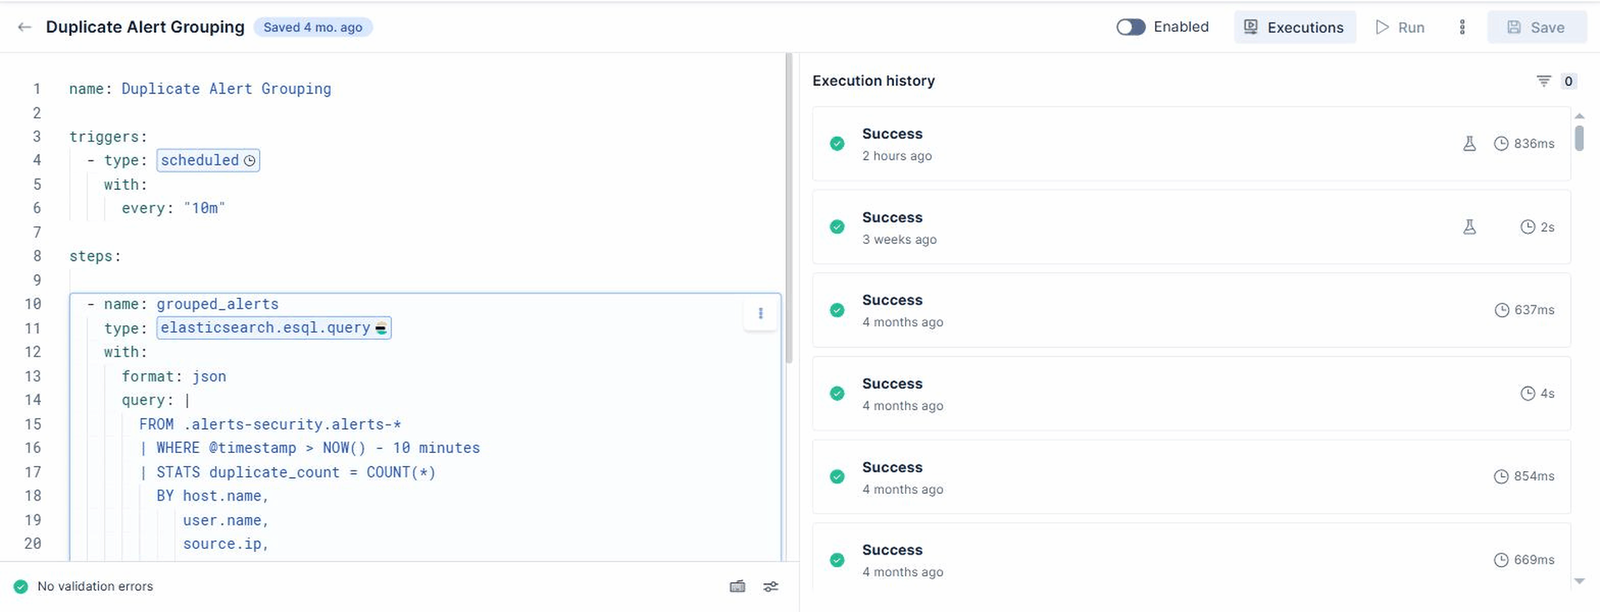
Today’s run sits at the top, above months of scheduled runs at 637ms, 854ms, 669ms, 508ms and one 4s outlier. Consistency like that is the argument for reading history instead of a single run: one 4s outlier among sub-second runs is cluster load, not a code change.
Across the whole index:
| Executions | 1,309 (12 May – 21 Sep 2026) |
| Completed | 1,216 |
| Failed | 92 |
| Cancelled | 1 |
| Success rate | 92.9% |
| Trigger split | scheduled 1,112 / manual 197 |
| Duration | min 228ms · avg 2,453ms · max 254,488ms |
That 254-second maximum against a 2.5-second average is the distribution to notice. It is not a slow query. Grouping the library by what a workflow actually touches:
| Workflow shape | Runs | Failed | Avg duration |
|---|---|---|---|
Query-only (ES|QL + console) |
1,004 | 0 | ~800ms |
| Query + case / connector delivery | 198 | 41 | 1.1–2.6s |
| Query + LLM agent | 19 | 12 | 15,960ms |
The pattern is unambiguous. Workflows that only query Elasticsearch approach 100% reliability at sub-second latency. Workflows that call out — connectors, third-party HTTP, LLM agents — own every failure and every slow run. The LLM-agent workflows average 16 seconds and fail more often than they succeed; the 254-second outlier is one of their runs. The pure-query workflows ran over a thousand times without a single failure.
The 92 failures
| Error type | Count |
|---|---|
ConnectorExecutionError |
55 |
ResponseError |
21 |
Error |
9 |
InputValidationError |
4 |
CaseError |
3 |
60% are connector failures — the workflow logic ran, the delivery didn’t. Grouped by message:
| Cause | Count |
|---|---|
[401] Unauthorized (three distinct endpoints) |
18 |
[403] Forbidden: @font-face{font-family:Poppins… |
15 |
verification_exception (ES|QL) |
14 |
[ENOTFOUND] getaddrinfo … your-threat-feed.example.com |
5 |
parsing_exception (ES|QL) |
4 |
Three are worth pulling out.
The @font-face one is the best error in the corpus. A 403 whose body is CSS means the HTTP step was handed an HTML login page instead of JSON. The endpoint wasn’t down and the request wasn’t malformed — a session had expired and something returned a sign-in page. Fifteen executions failed against a login screen. An http step will happily POST at anything; it cannot tell you that what came back was a web page.
your-threat-feed.example.com is a placeholder that reached production. Five scheduled executions failed on DNS because a template value was never replaced. It failed loudly, which is the good outcome — the same oversight in a WHERE clause fails silently and returns nothing.
18 ES|QL exceptions. verification_exception is a field that doesn’t exist or has become ambiguously mapped; parsing_exception is a syntax error. Both are caught at query planning, so the step fails fast and cheap. Most are preventable by running the query in Discover first — but not all, as the ingestion monitor shows: a query can be correct when written and fail months later because the indices underneath it changed.
Failure detail is positional, and that is the point
The execution pane marks each step individually, not just the run. In the recurring failure shape here, several ES|QL steps finish green and only the final delivery step goes red, carrying:
error.type    : ConnectorExecutionError
error.message : [401] Unauthorized: The authentication credentials are not valid.
That tells you the gathered result sets are intact and the only broken thing is a credential in a connector. A single top-level “failed” status would have sent someone re-reading ES|QL for an hour.
It also exposes a design consequence: there is no partial-success state and no resumption. A workflow like that does all of its work and then discards it because a token expired at the last step. The next scheduled run redoes every query from scratch. If the gathering phase is expensive, put it behind its own workflow and pass results through an index rather than a step boundary.